── Attaching core tidyverse packages ──────────────────────── tidyverse 2.0.0 ──
✔ dplyr     1.1.4     ✔ readr     2.1.5
✔ forcats   1.0.0     ✔ stringr   1.5.1
✔ ggplot2   3.5.1     ✔ tibble    3.2.1
✔ lubridate 1.9.3     ✔ tidyr     1.3.1
✔ purrr     1.0.2
── Conflicts ────────────────────────────────────────── tidyverse_conflicts() ──
✖ dplyr::filter() masks stats::filter()
✖ dplyr::lag()    masks stats::lag()
ℹ Use the conflicted package (<http://conflicted.r-lib.org/>) to force all conflicts to become errors
library(sf)
Linking to GEOS 3.12.1, GDAL 3.8.4, PROJ 9.3.1; sf_use_s2() is TRUE
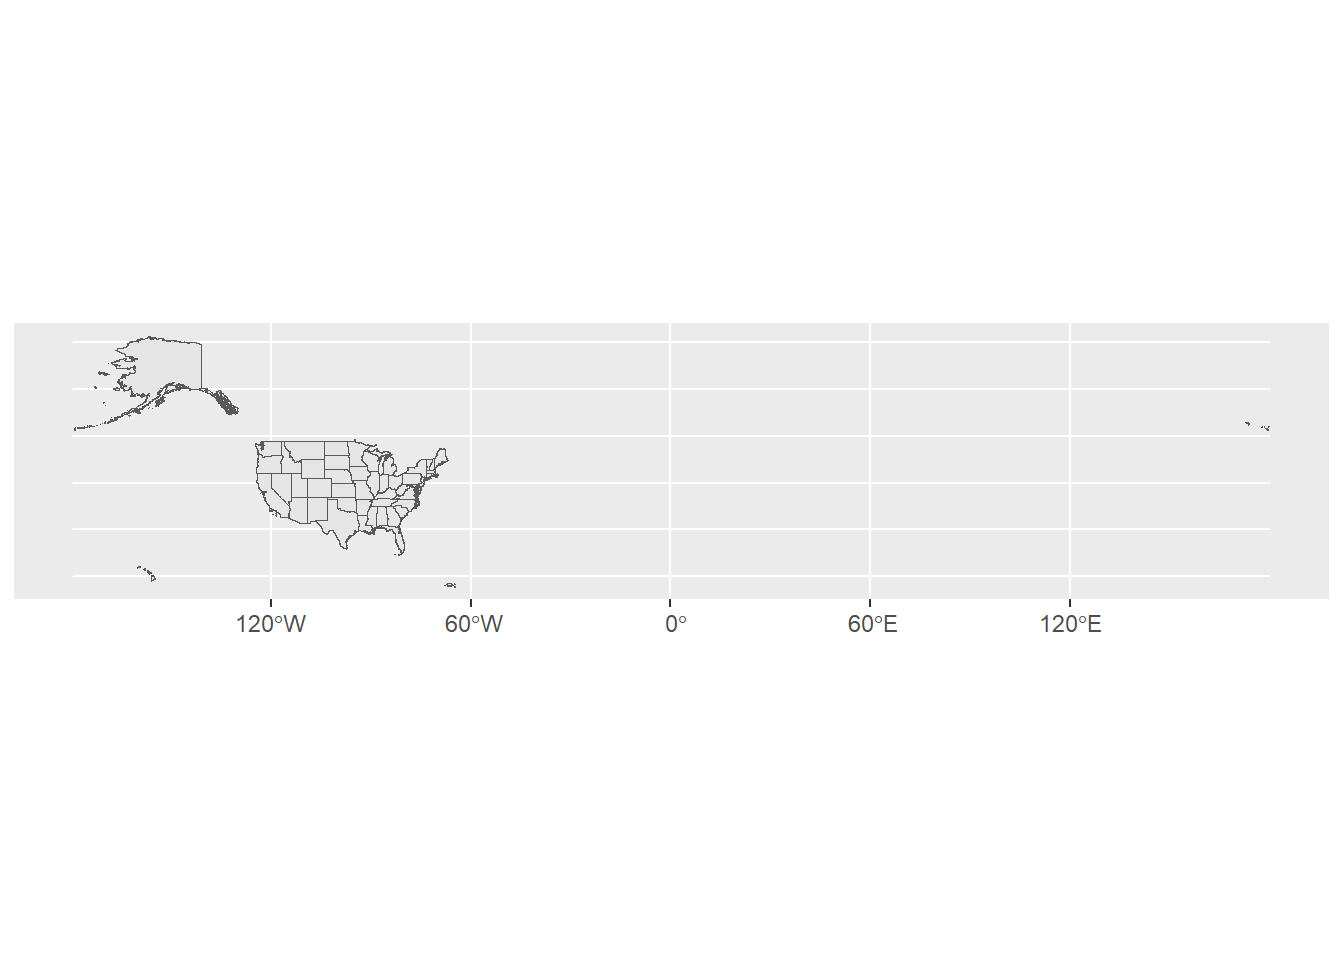
#read in spatial dataallStates<-st_read(("US_State_Boundaries.shp"))
Reading layer `US_State_Boundaries' from data source
  `C:\Users\bdav_\Dropbox\Teaching\ENV 170\Fall 2024\R\mappingAKHI\US_State_Boundaries.shp'
  using driver `ESRI Shapefile'
Simple feature collection with 53 features and 16 fields
Geometry type: MULTIPOLYGON
Dimension:     XY
Bounding box:  xmin: -179.1474 ymin: 17.6744 xmax: 179.7784 ymax: 71.38921
Geodetic CRS:  WGS 84
#plot itggplot()+geom_sf(data=allStates)
With tigris package
#install.packages(tigris)library(tigris)
Warning: package 'tigris' was built under R version 4.4.2
To enable caching of data, set `options(tigris_use_cache = TRUE)`
in your R script or .Rprofile.
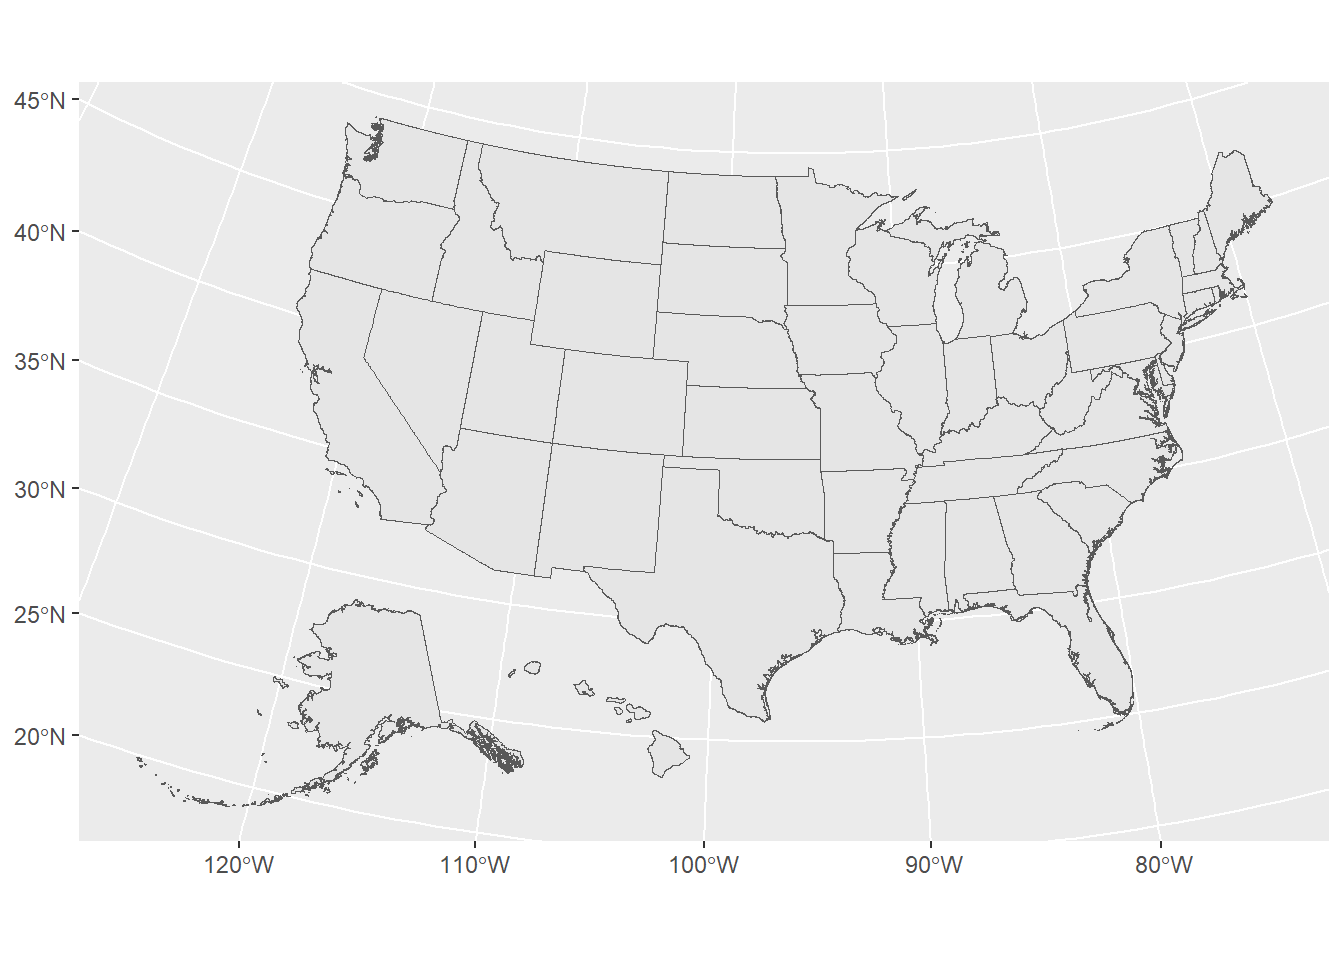
#filter to create a new dataset with 50 States (no territories)fiftyStates<-allStates %>%filter(OBJECTID %in%c(1:25,28:60))#Offset AK and HI using shift_geometry function from tigrisfiftyStatesShifted<-shift_geometry(fiftyStates,position=c("below"))#plot new mapggplot()+geom_sf(data=fiftyStatesShifted)