Environmental Data Analysis and Visualization
The Data Goes On and On (and On and On)…
Visualization critique
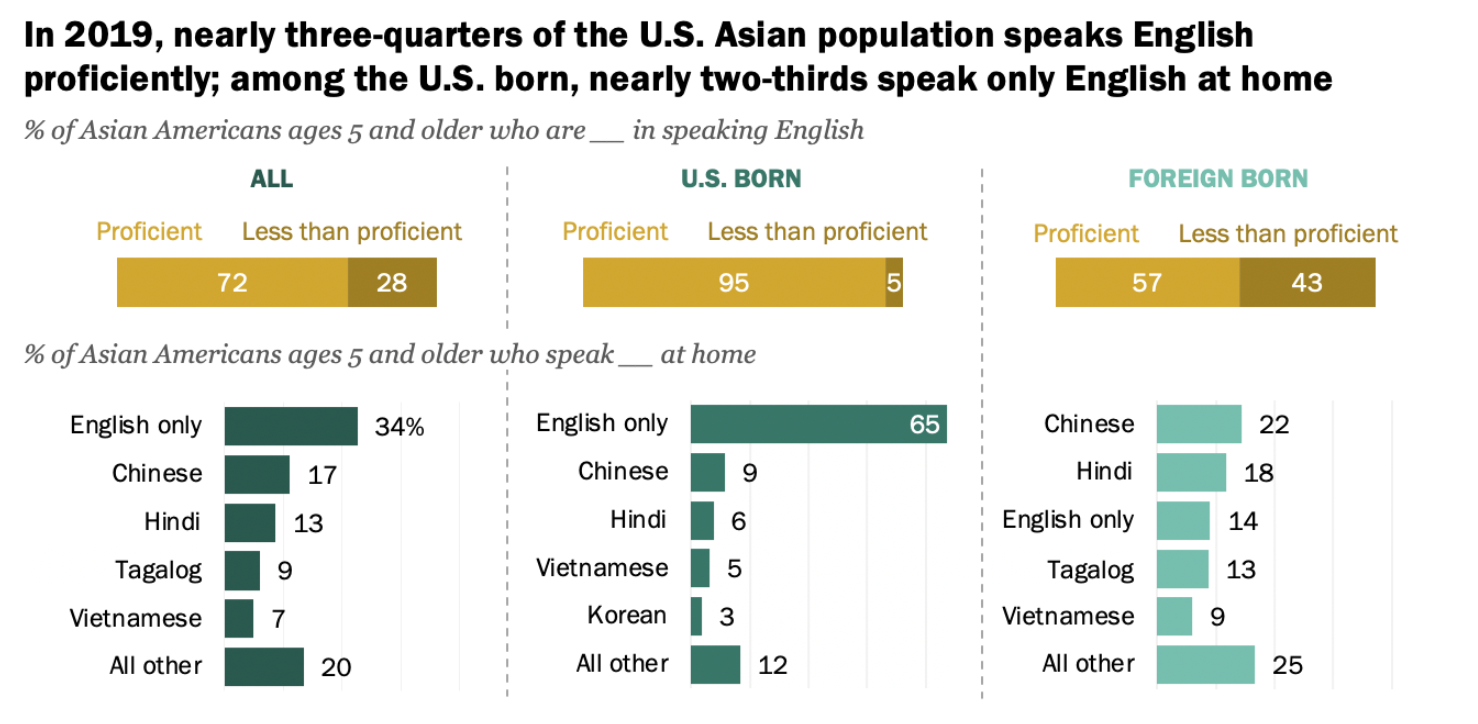
Visualization critique
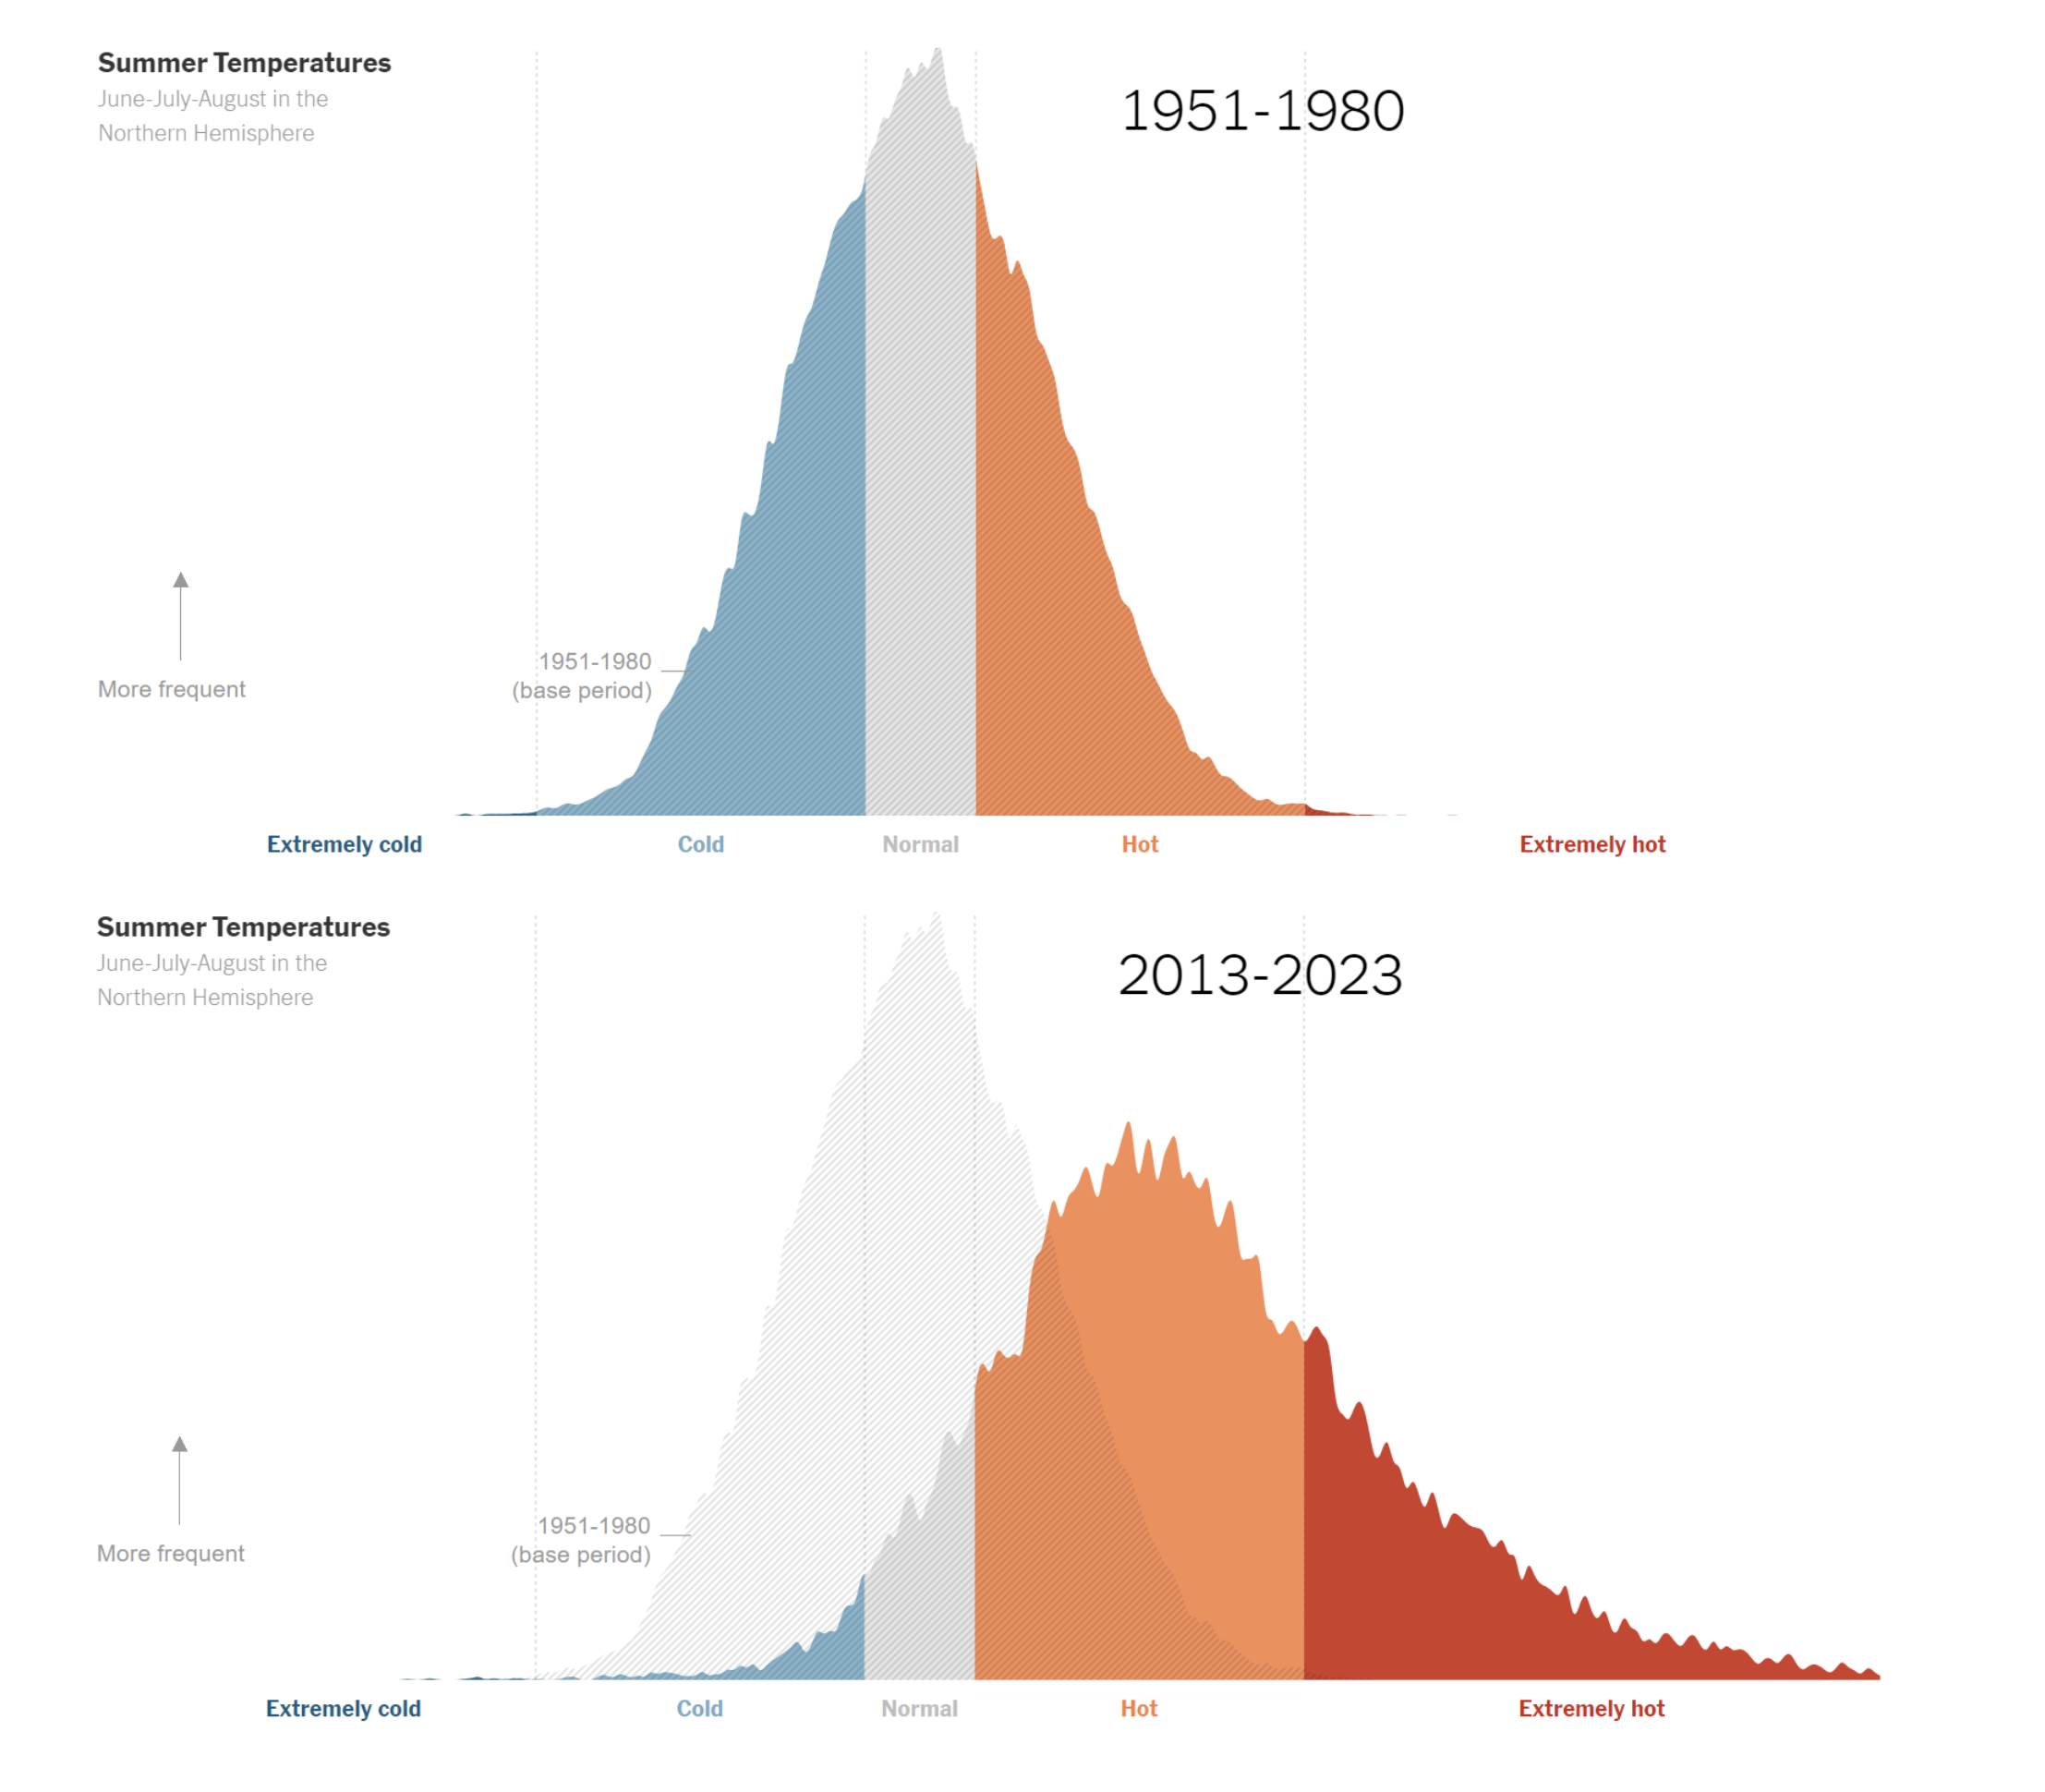
Visualization critique
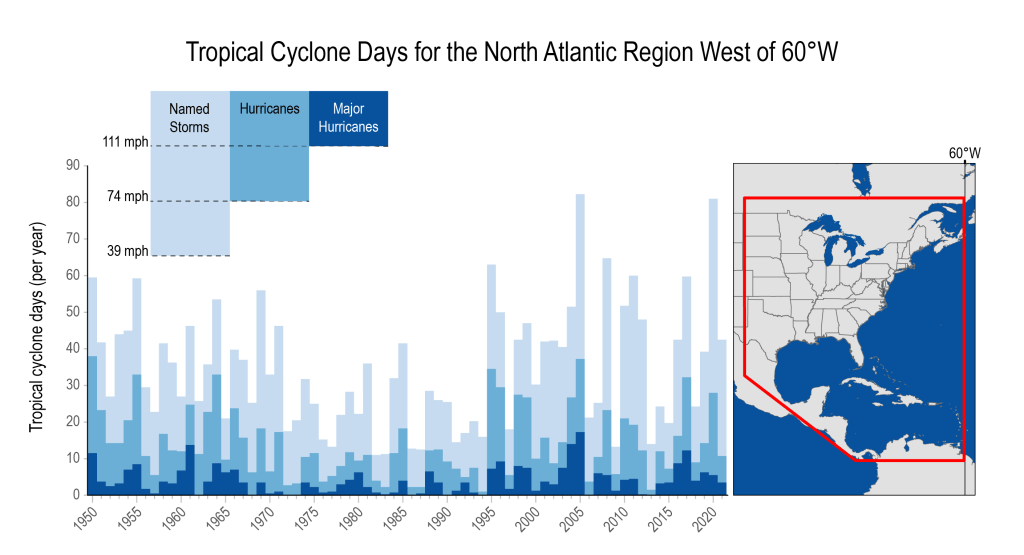
Visualization critique
Meredith
Griffin
Charlotte
Dataset of the day
Massachusetts Community Health Data
Raster data
Rasters are used to represent spatial information that has a continuous distribution.
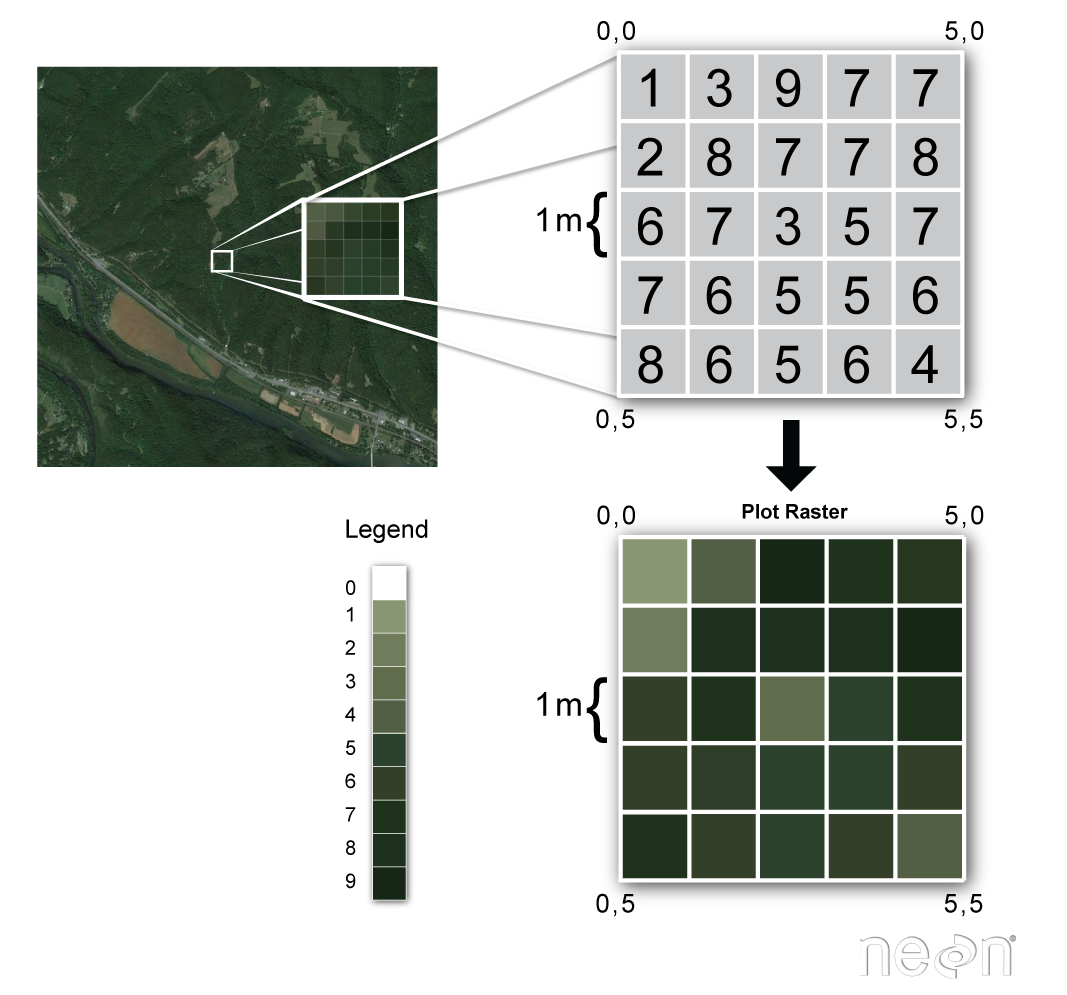
datacarpentry.org
What kind of data comes as a raster?

Satellite imagery
Climate model outputs
Oceanographic data
Elevation models
Raster algebra
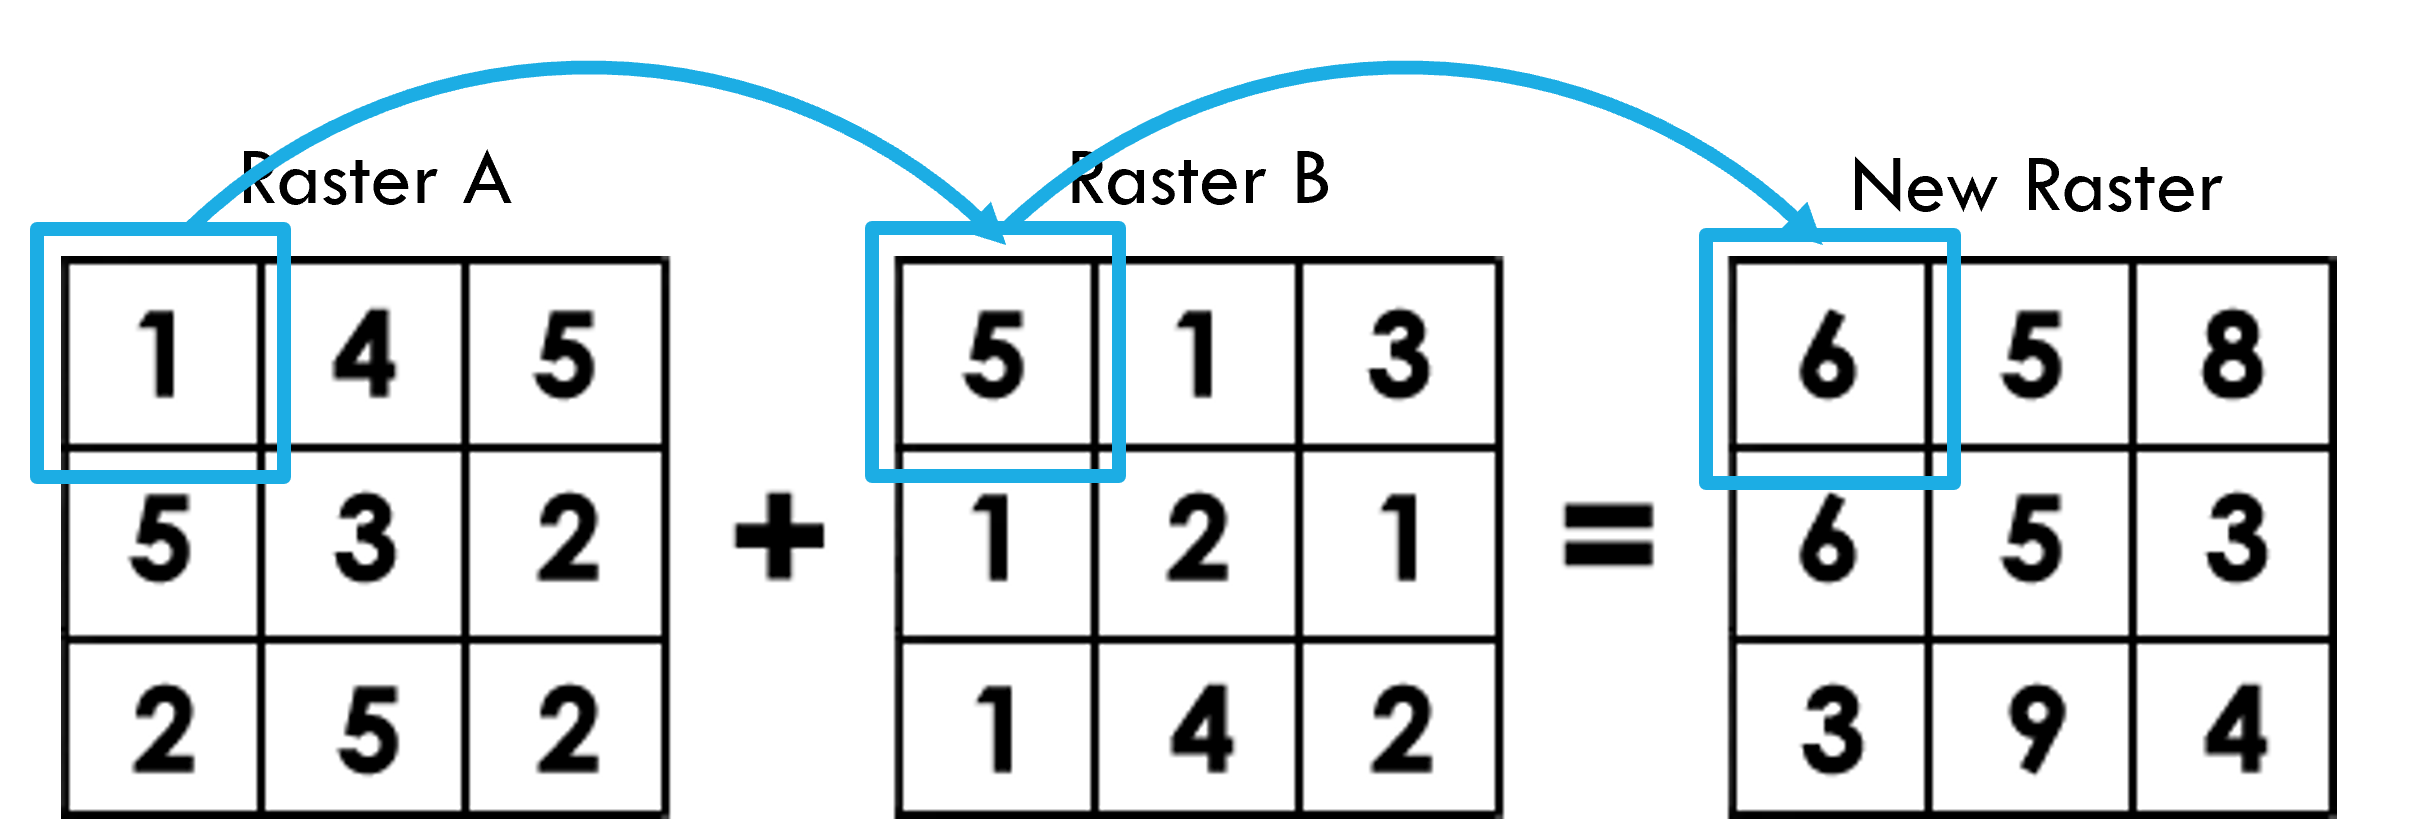
Raster cells contain values that can be combined with cell values of other rasters at the same locations to produce a new raster
Raster data in R

Faster and easier than earlier raster package
Extends to ggplot2 and dplyr with the tidyterra package
Next week
Plotting out your projects
Postering 101
From tests to predictions