Environmental Data Analysis and Visualization
Warm-Up Activity
Convert the airquality dataset (from the datasets package) to a tibble and create a scatterplot with a smooth line showing the relationship between temperature and ozone levels for each month in the dataset. You may find the following functions helpful in this process:
facet_wrapto make a faceted plotvarsto define which variable to use for facetsdrop_nato remove rows with NA values in certain columnsas.characterto coerce numbers or other data types to character values
First look

Labeling facets
Facets are not treated as part of the aesthetic mapping in aes. One way to relabel these is to use fct_recode inside the vars function to change the factor names.
Labeling facets

Editing facet axis scales
For the same reason, we can’t access facet axis scales using any scales_* functions. We can modify these in the facet_wrap function with the scales argument.
Editing facet axis scales

Editing facet axis scales
We can change a single scale with the argument “free_x” or “free_y”.

Editing facet axis scales

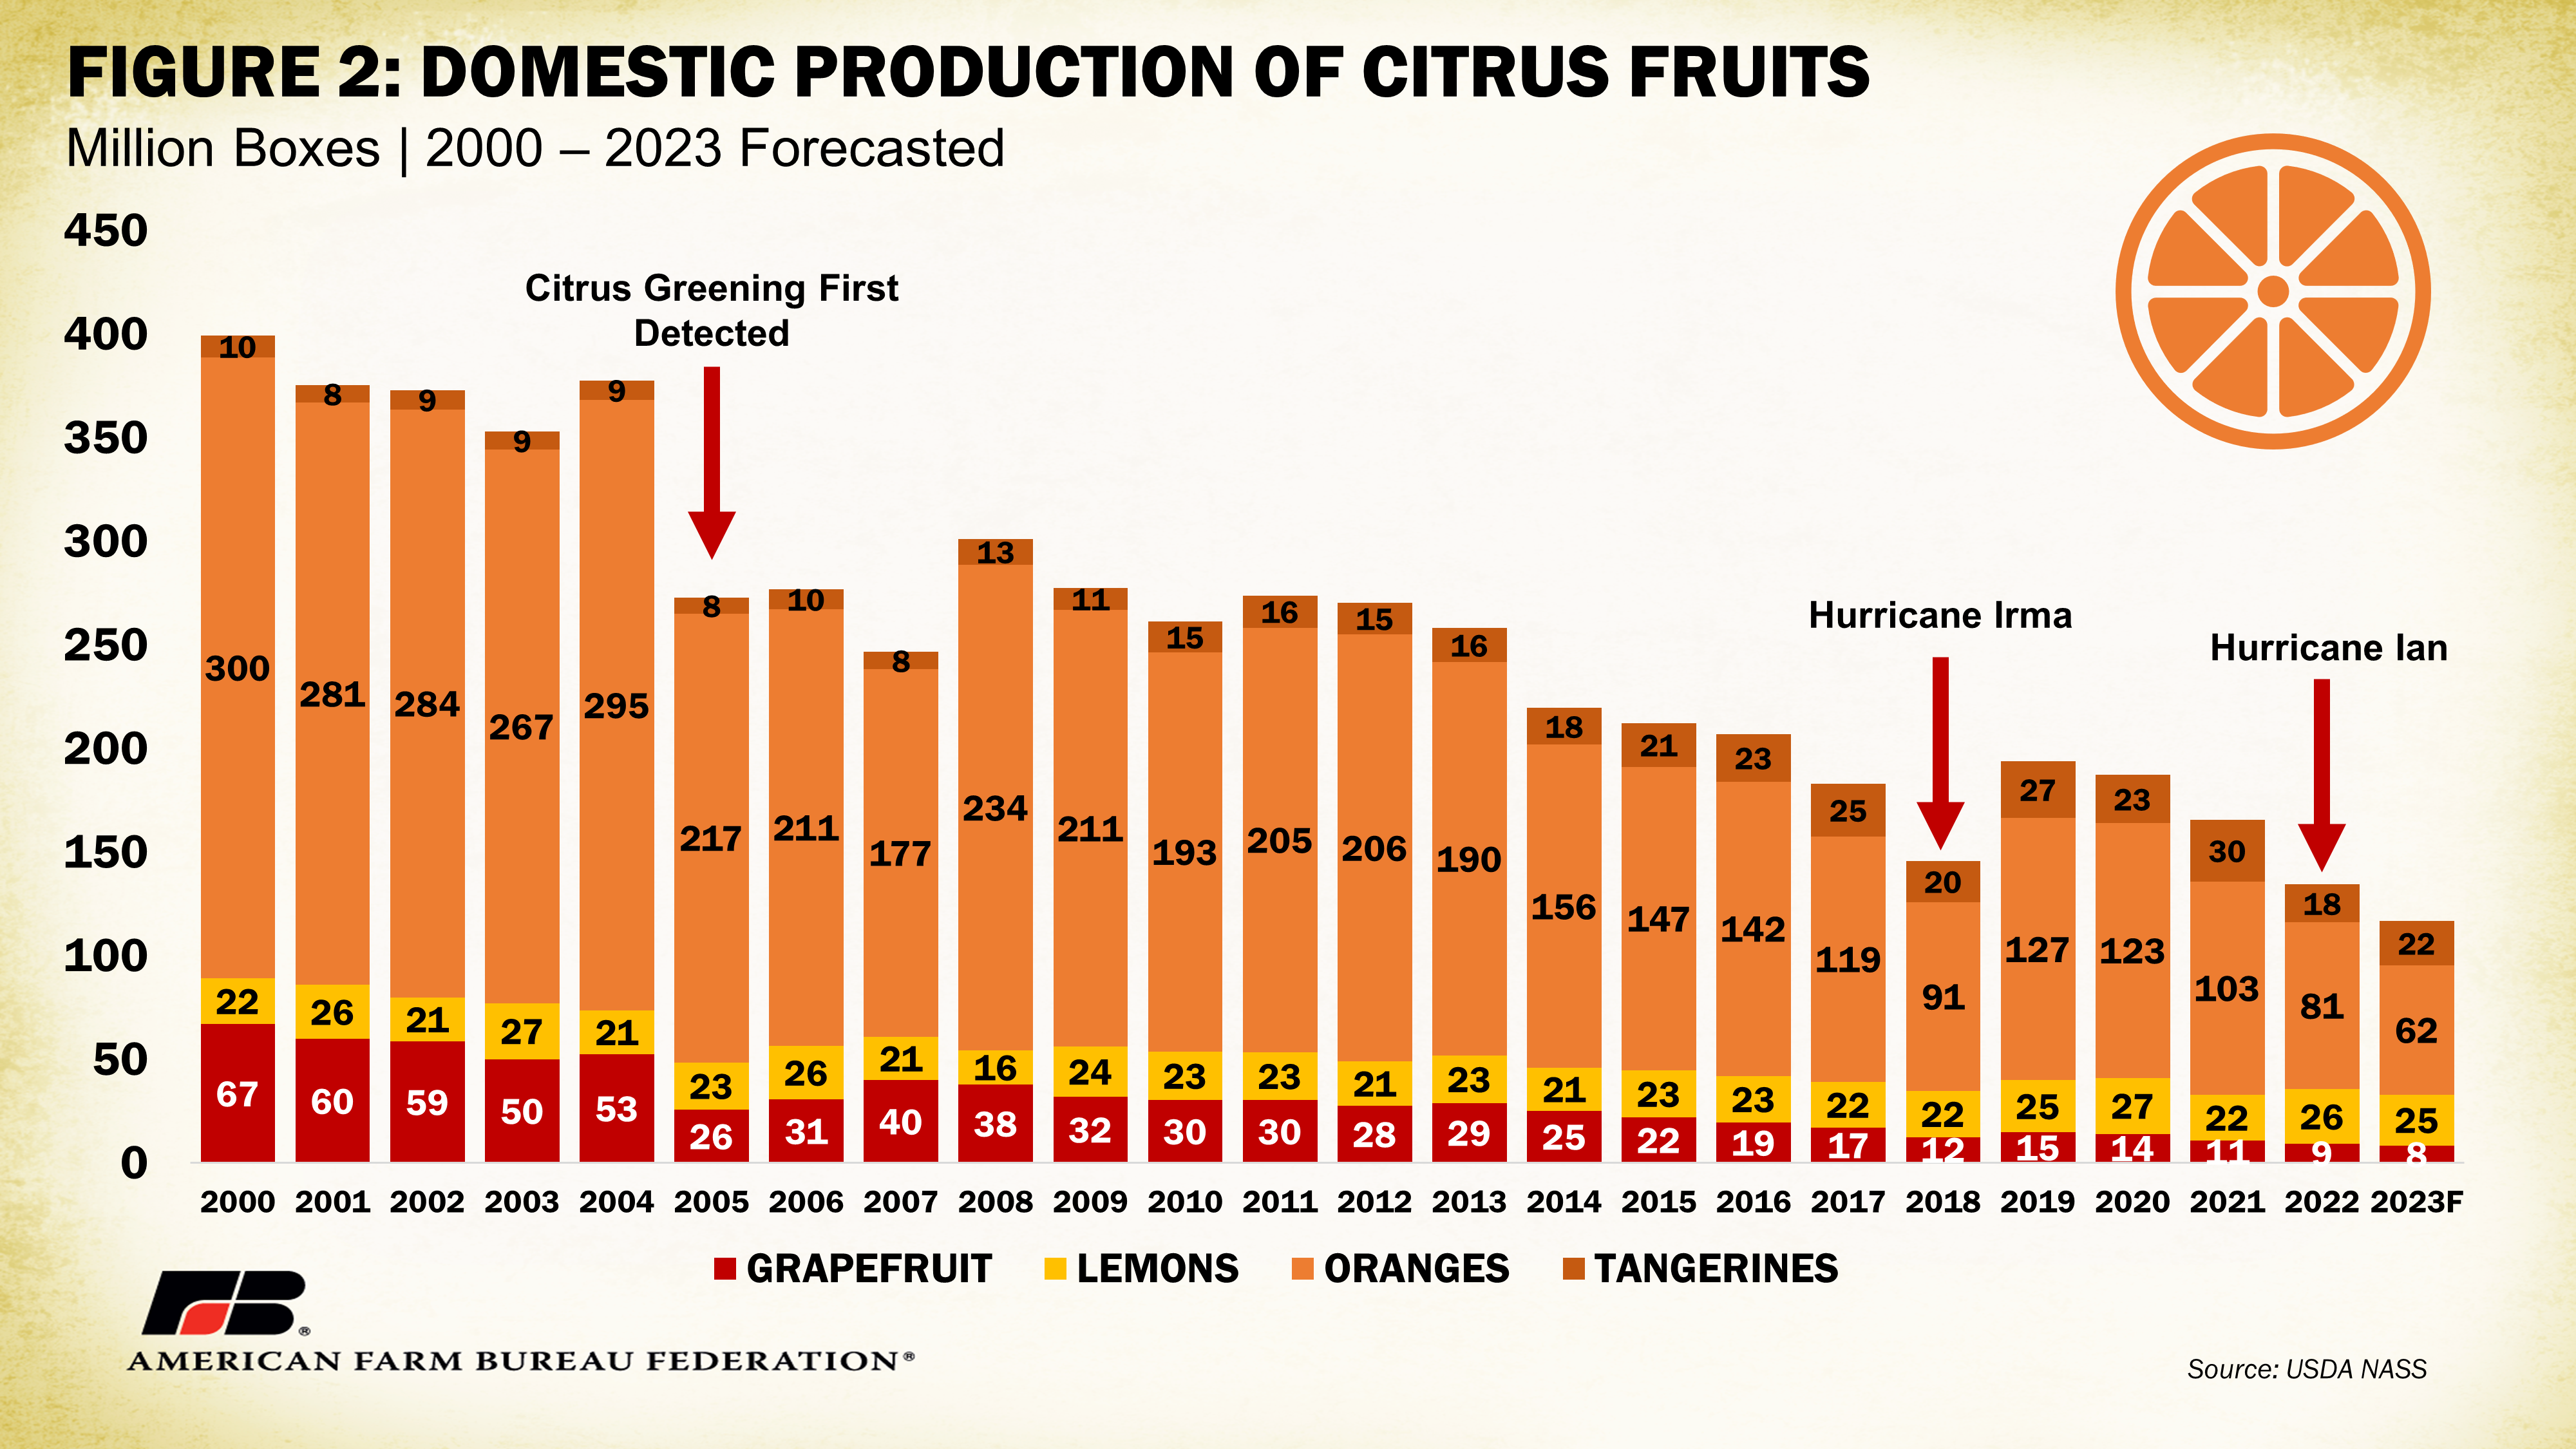
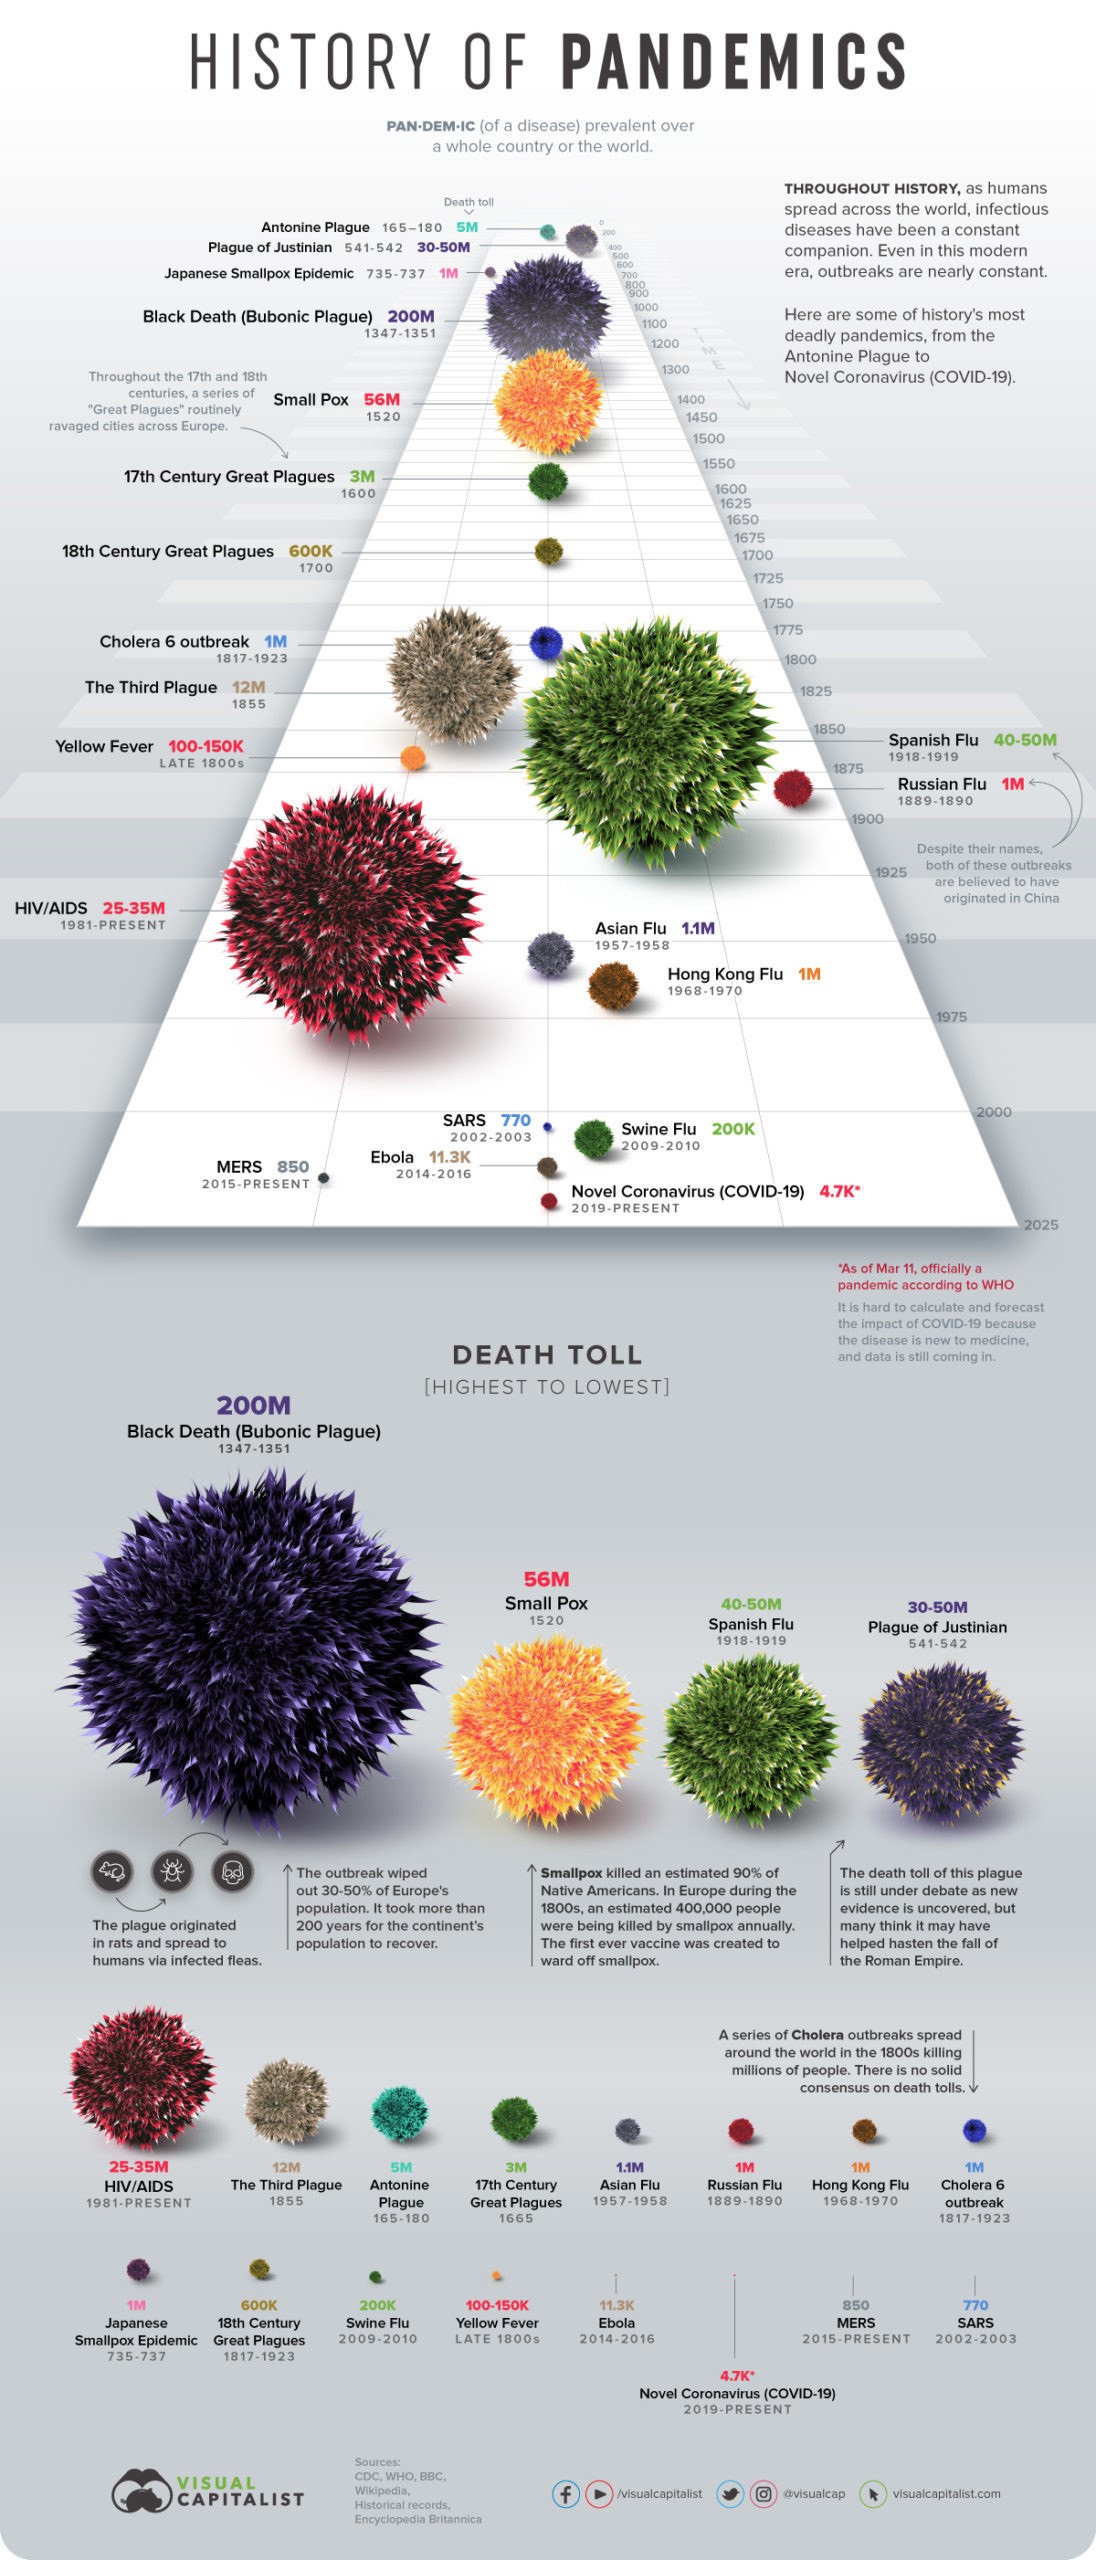
Visualization critique

Visualization critique
Visualization critique
weforum.org
Next visualization critiques
Emma
Gracie
Sahm
Sensor Dataset of the day
General Social Survey
Ethics in research
Researchers operate inside of a society with norms, values, and expectations
Ethics in research
Researchers operate inside of a society with norms, values, and expectations
To behave ethically is to behave in a way that is considered socially responsible
Ethics in research
Human subjects
Operates on principles of non-maleficence, beneficence, autonomy, and justice
Requires informed consent of participants
Uses anonymity and confidentiality to protect identities
Animal subjects
Operates on principles of non-maleficence, beneficence, and justice
Where possible, researchers must aim for replacement, reduction, and refinement
Ethics in research
Human subjects
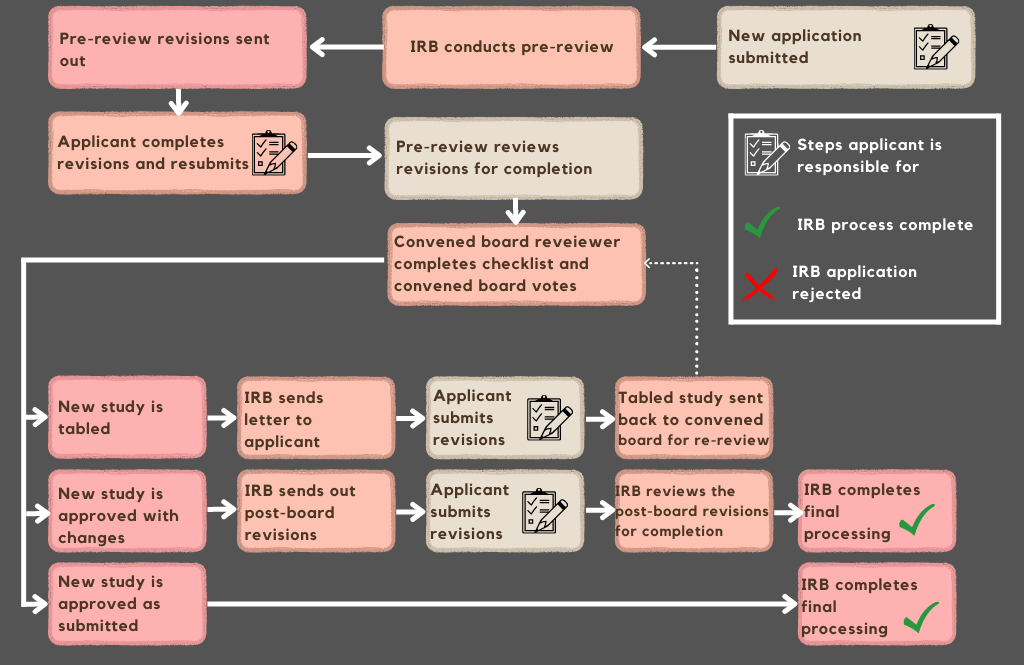
- Requires review by Institutional Review Board (IRB)
Animal subjects
- Requires review by Institutional Review Board (IRB)
Institutional Review Board
University of Utah
Data ethics
Data science makes use data that is available from a variety of sources, often in ways that are not directly connected to the original data collection process
Data ethics
Data science makes use data that is available from a variety of sources, often in ways that are not directly connected to the original data collection process
At the same time, there are limited oversights governing the reuse of data by researchers or others.
Data ethics
Data ethics
Data ethics
Non-maleficence: Could the use of this data be harmful?
Beneficence: How will the use of this data be beneficial?
Autonomy: Did stakeholders contribute this data willingly?
Justice: Would use of this data propagate inequities?
Ethical data
How were the data obtained?
For whom, or for what purpose, were the data obtained?
Would stakeholders be comfortable if they knew the data were being collected, stored or shared?
Ethical data
The 2012 Facebook Social Contagion Study
Ethical data
The 2012 Facebook Social Contagion Study
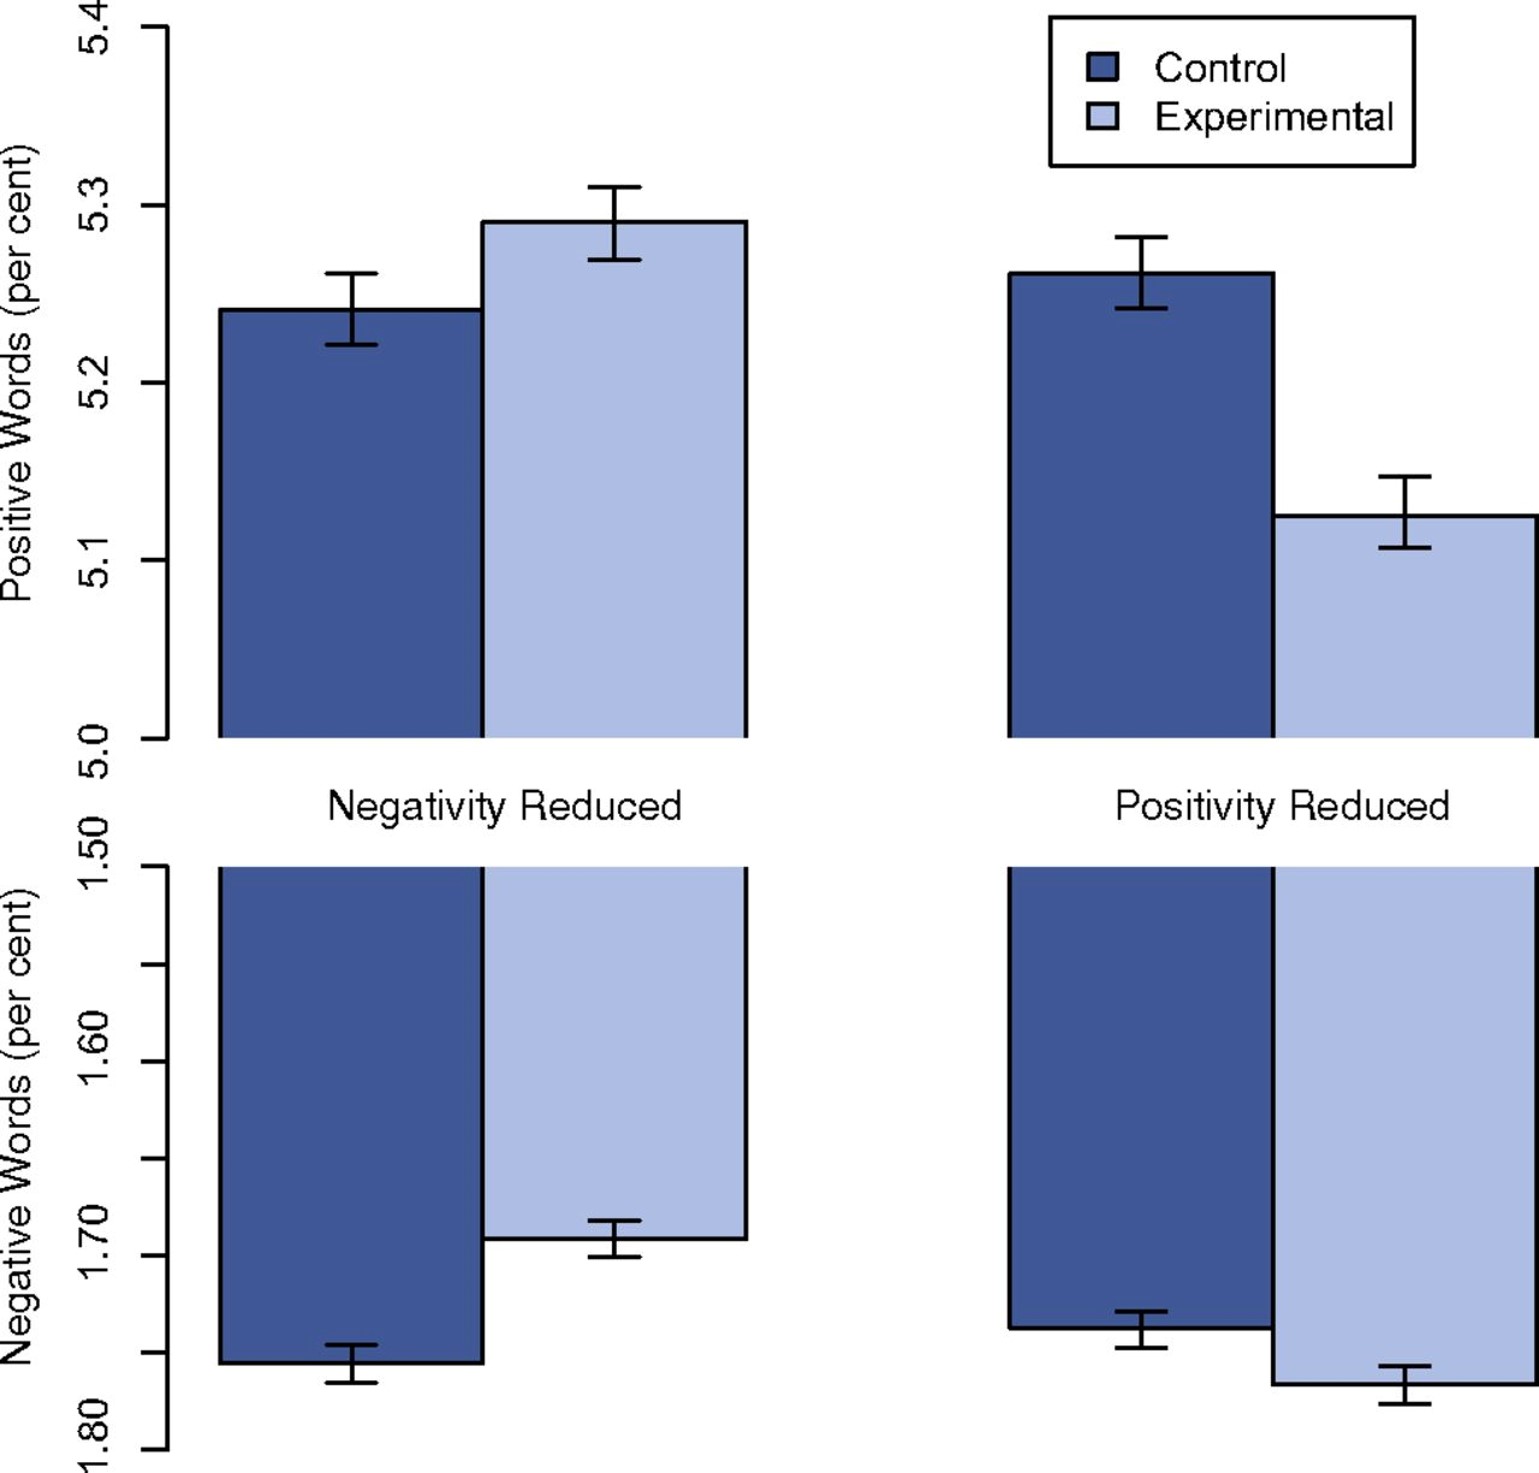
Kramer, Adam D. I., Jamie E. Guillory, and Jeffrey T. Hancock. 2014. “Experimental Evidence of Massive-Scale Emotional Contagion through Social Networks.” Proceedings of the National Academy of Sciences 111 (24): 8788–90. https://doi.org/10.1073/pnas.1320040111.
Confronting biases
How might the data be biased?
How might the data be manipulated to bias results?
How might data be used to promote existing biases?
Confronting biases
Confronting biases

Towards Data Science
Activity: Let’s get ethical
Take a moment and go over one or more of your datasets from your project to address the following questions:
What do you know about where your data comes from? Where would you find out?
What are some potential sources of bias in your data?
Are there any ways your use of this data cause harm or propagate biases?
With one of your neighbors, discuss your project in terms of ethical principles of non-maleficence, beneficence, autonomy, and justice.
Data ethics
Non-maleficence: Could the use of this data be harmful?
Beneficence: How will the use of this data be beneficial?
Autonomy: Did stakeholders contribute this data willingly?
Justice: Would use of this data propagate inequities?
Ethics in data storytelling
Where do we draw the line between narrative and agenda?
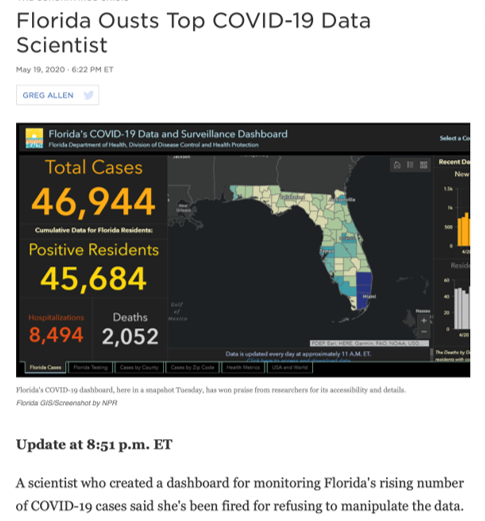
National Public Radio
Global Charter of Ethics for Journalists
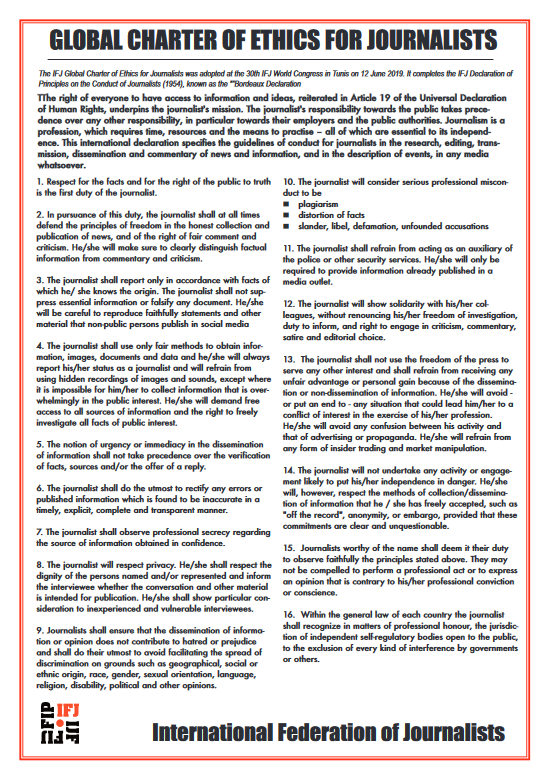
Global Charter of Ethics for Journalists

Making choices
“When a designer chooses a graphic form to represent data just because she likes it, while ignoring evidence that may lead her to choose a more appropriate one, her act is morally wrong. It’s not wrong just because she’s not been virtuous or because there is a deontological rule against inappropriate charts, but because her act will likely have negative consequences, such as confusion, obfuscation and misunderstanding.” -Alberto Cairo, “Ethical Infographics”
Coming up
Bless this mess: Messy data and the
tidyverse|> (or %>%) dreams