Where is your favorite place to eat on or near the Tufts campus?
About us
Instructor
Ben Davies
benjamin.davies@tufts.edu
Teaching Assistant
Courtney King
courtney.king662186@tufts.edu
About this course
This course is designed to develop skills and knowledge needed to assemble, manage, visualize, analyze, and communicate about environmental data. Students will learn fundamental data science concepts and computational techniques needed to
access data from a variety of sources;
organize and reshape datasets to suit different purposes;
plot data to evaluate patterns;
assess the robustness and uniqueness of those patterns;
share their findings to different audiences.
About this course
Students will also explore how aesthetic design choices contribute to the usefulness of visualizations for telling environmental stories and best practices for making data and open and accessible for public reuse.
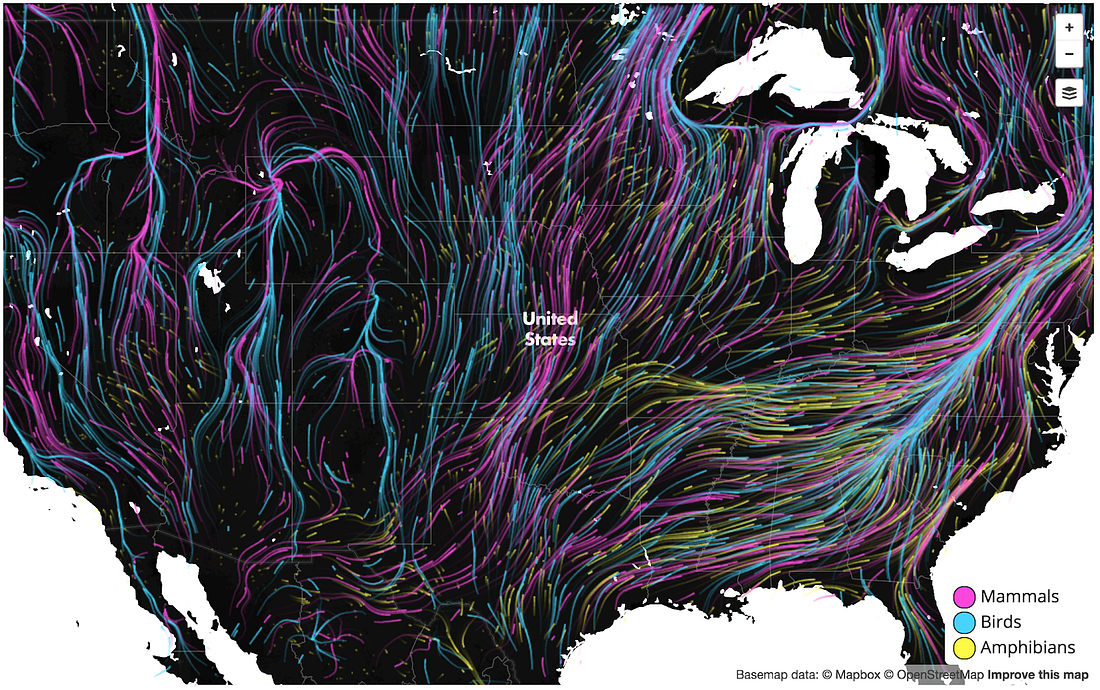
Why use data to build narratives?
NASA Scientific Visualization Studio (https://svs.gsfc.nasa.gov/5137/)
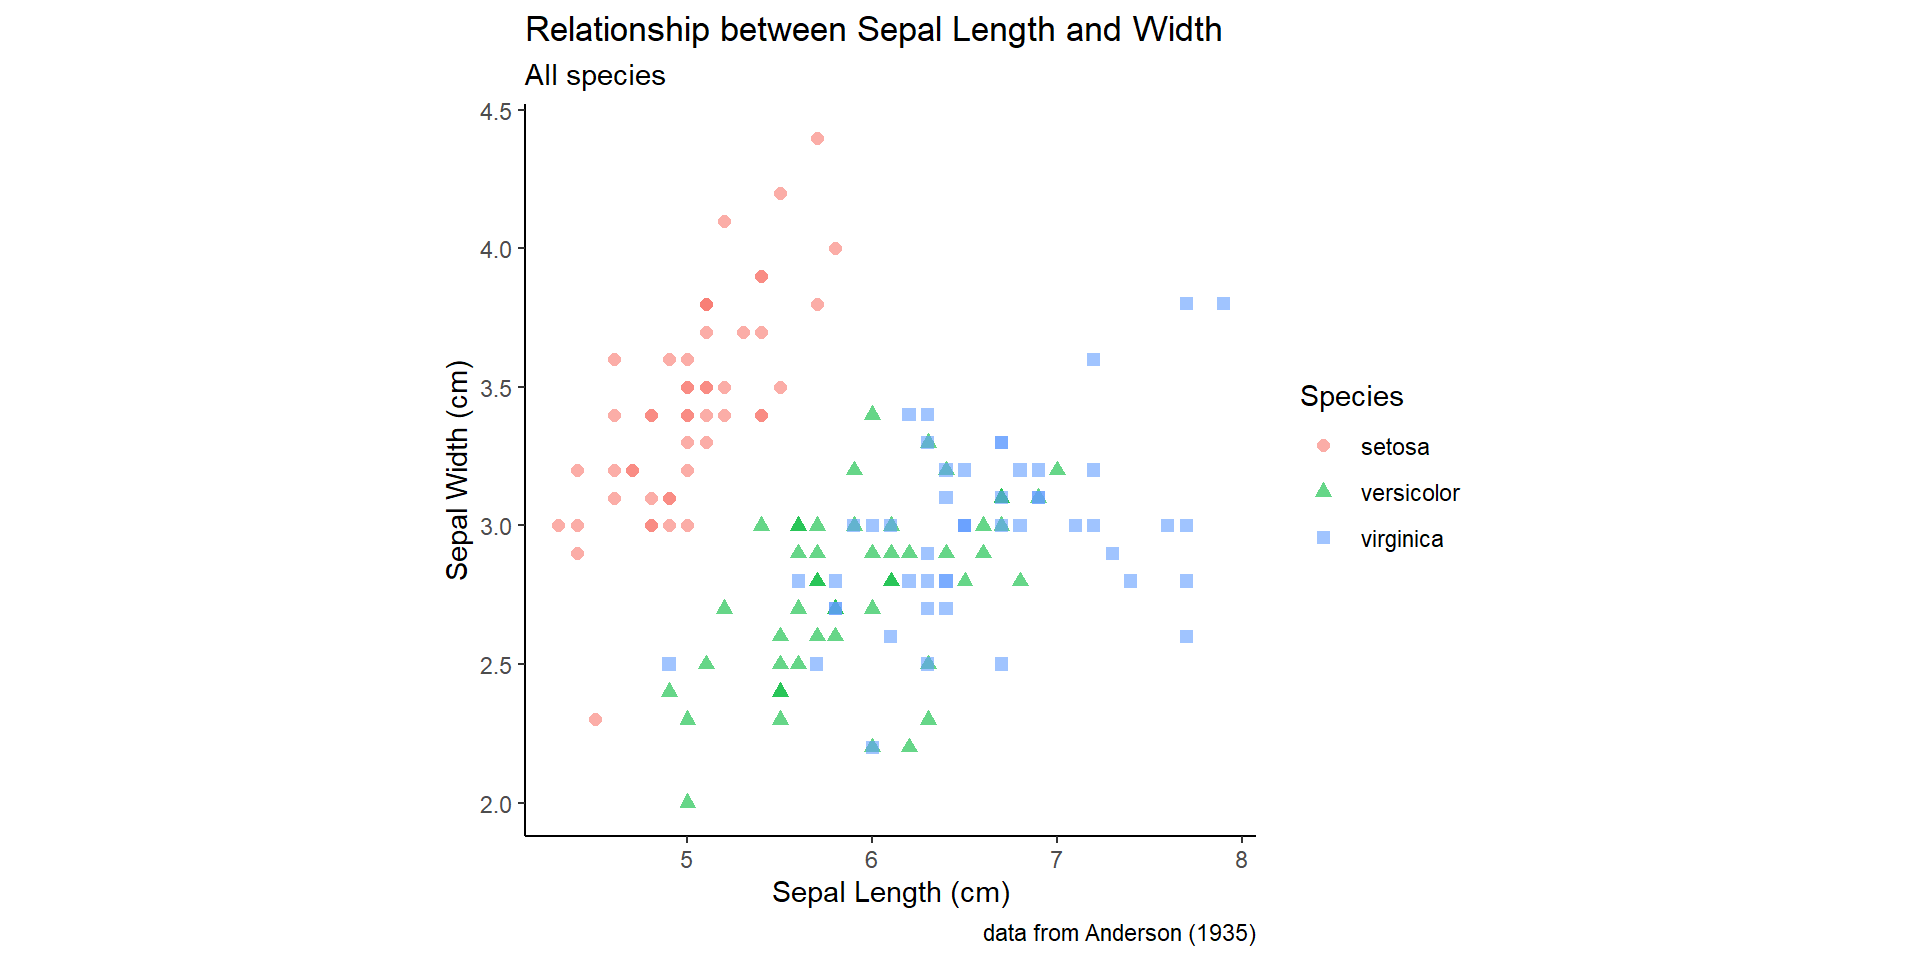
library(ggplot2)sepal.labels <-labs(x ="Sepal Length (cm)", y ="Sepal Width (cm)",title ="Relationship between Sepal Length and Width",caption ="data from Anderson (1935)")my.theme <-theme_classic() +theme(aspect.ratio =1)all.sepals <-ggplot(iris, aes(x = Sepal.Length, y = Sepal.Width))all.sepals +geom_point(aes(color = Species, shape = Species), size =2, alpha =0.6) + sepal.labels +labs(subtitle ="All species") + my.theme
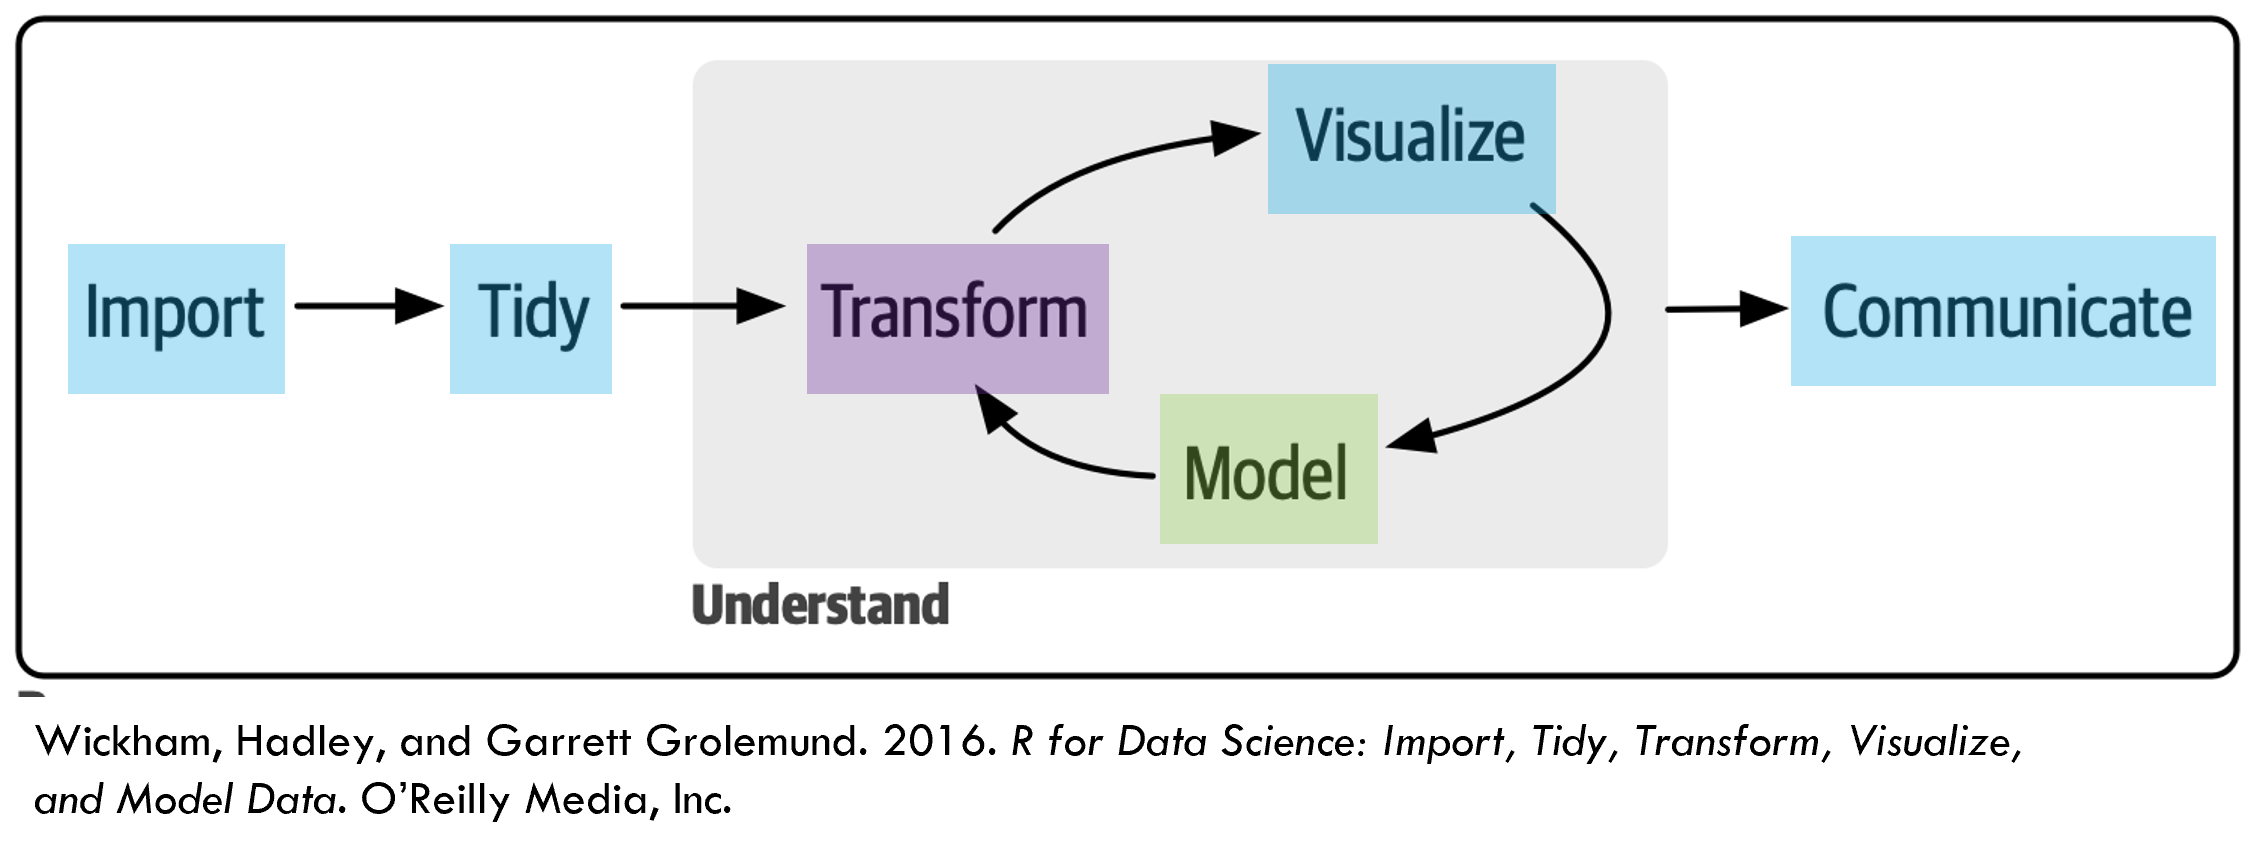
How we get there
Why use R?
R is a versatile software platform focused on data and visualization
R is free to use
R has a large and active user base
What we need from you
Be respectful
Attend lectures and recitations
Submit assignments on time
If there is something you don’t understand or want to know more about, say so
If you hear something you disagree with, say so
Learning how to ask questions
“Beginners face a language problem: they can’t ask questions because they don’t know what the words mean, they can’t know what the words mean until they can successfully use the system, and they can’t successfully use the system because they can’t ask questions.”
-Phil Agre, How to help someone use a computer
Course assessment
Assessment
Weight
Due Dates
Week Number
Lab exercises
30%
Weekly
Weeks 1 - 12
Coding assignments
25%
Varies
Weeks 4, 6, 8, 10, 12
Visualization critique
10%
Varies
Starting Week 4
Project proposal
5%
October 17th
Week 7
Project notebook
15%
November 30th
Week 13
Project poster
15%
December 7th
Week 14
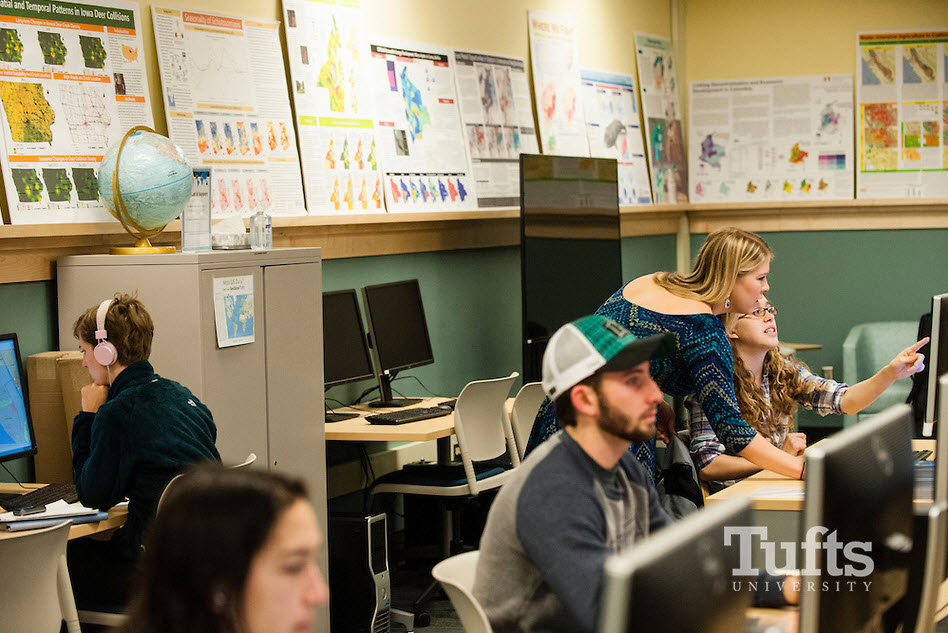
Resources
Data Lab at Tufts (https://sites.tufts.edu/datalab/services-support/student-lab-assistants/)