Environmental Data Analysis and Visualization
Warm-up exercise
Download and read in the abalone dataset
Create a dataset that contains only length, diameter, whole weight, and rings; be sure to multiply the numeric values by 200 to bring the data back to their correct values
Using a hypothesis test, evaluate the relationship between either
Diameter and number of rings
Length and whole weight
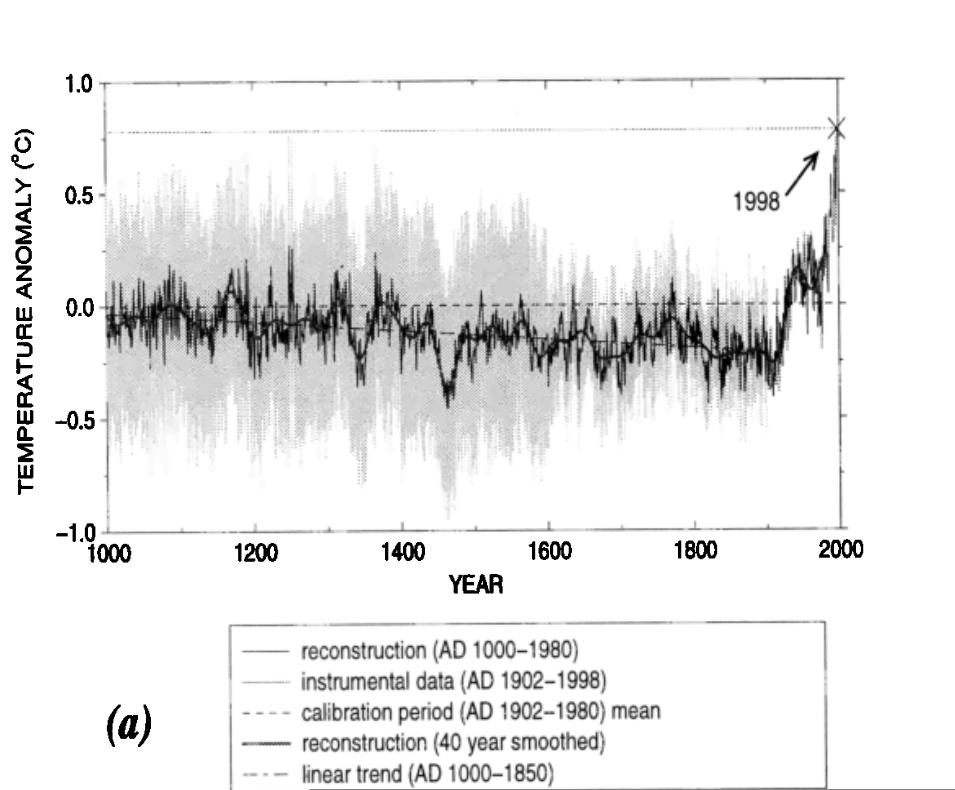
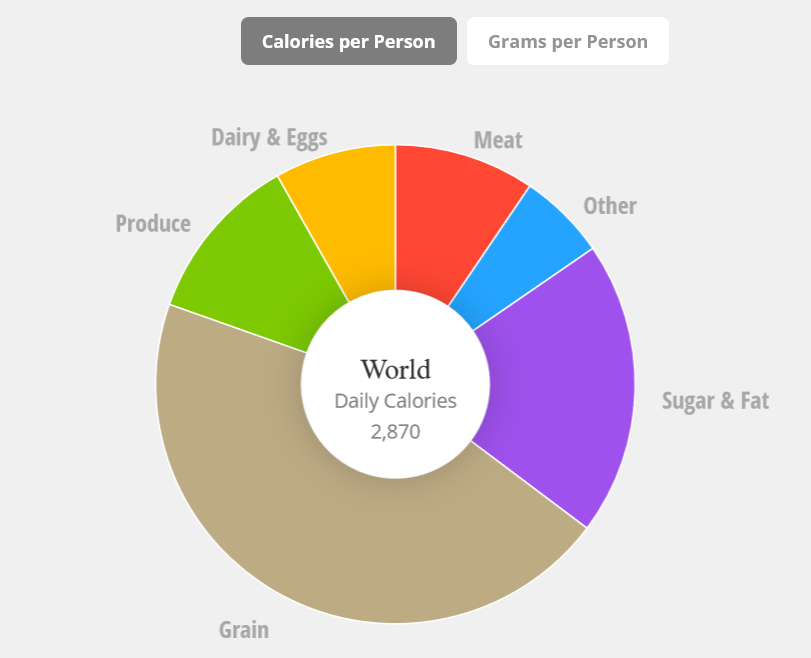
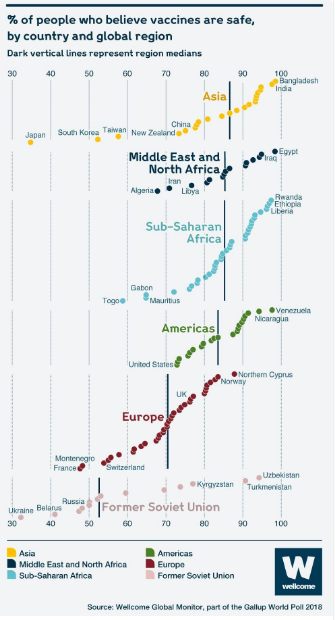
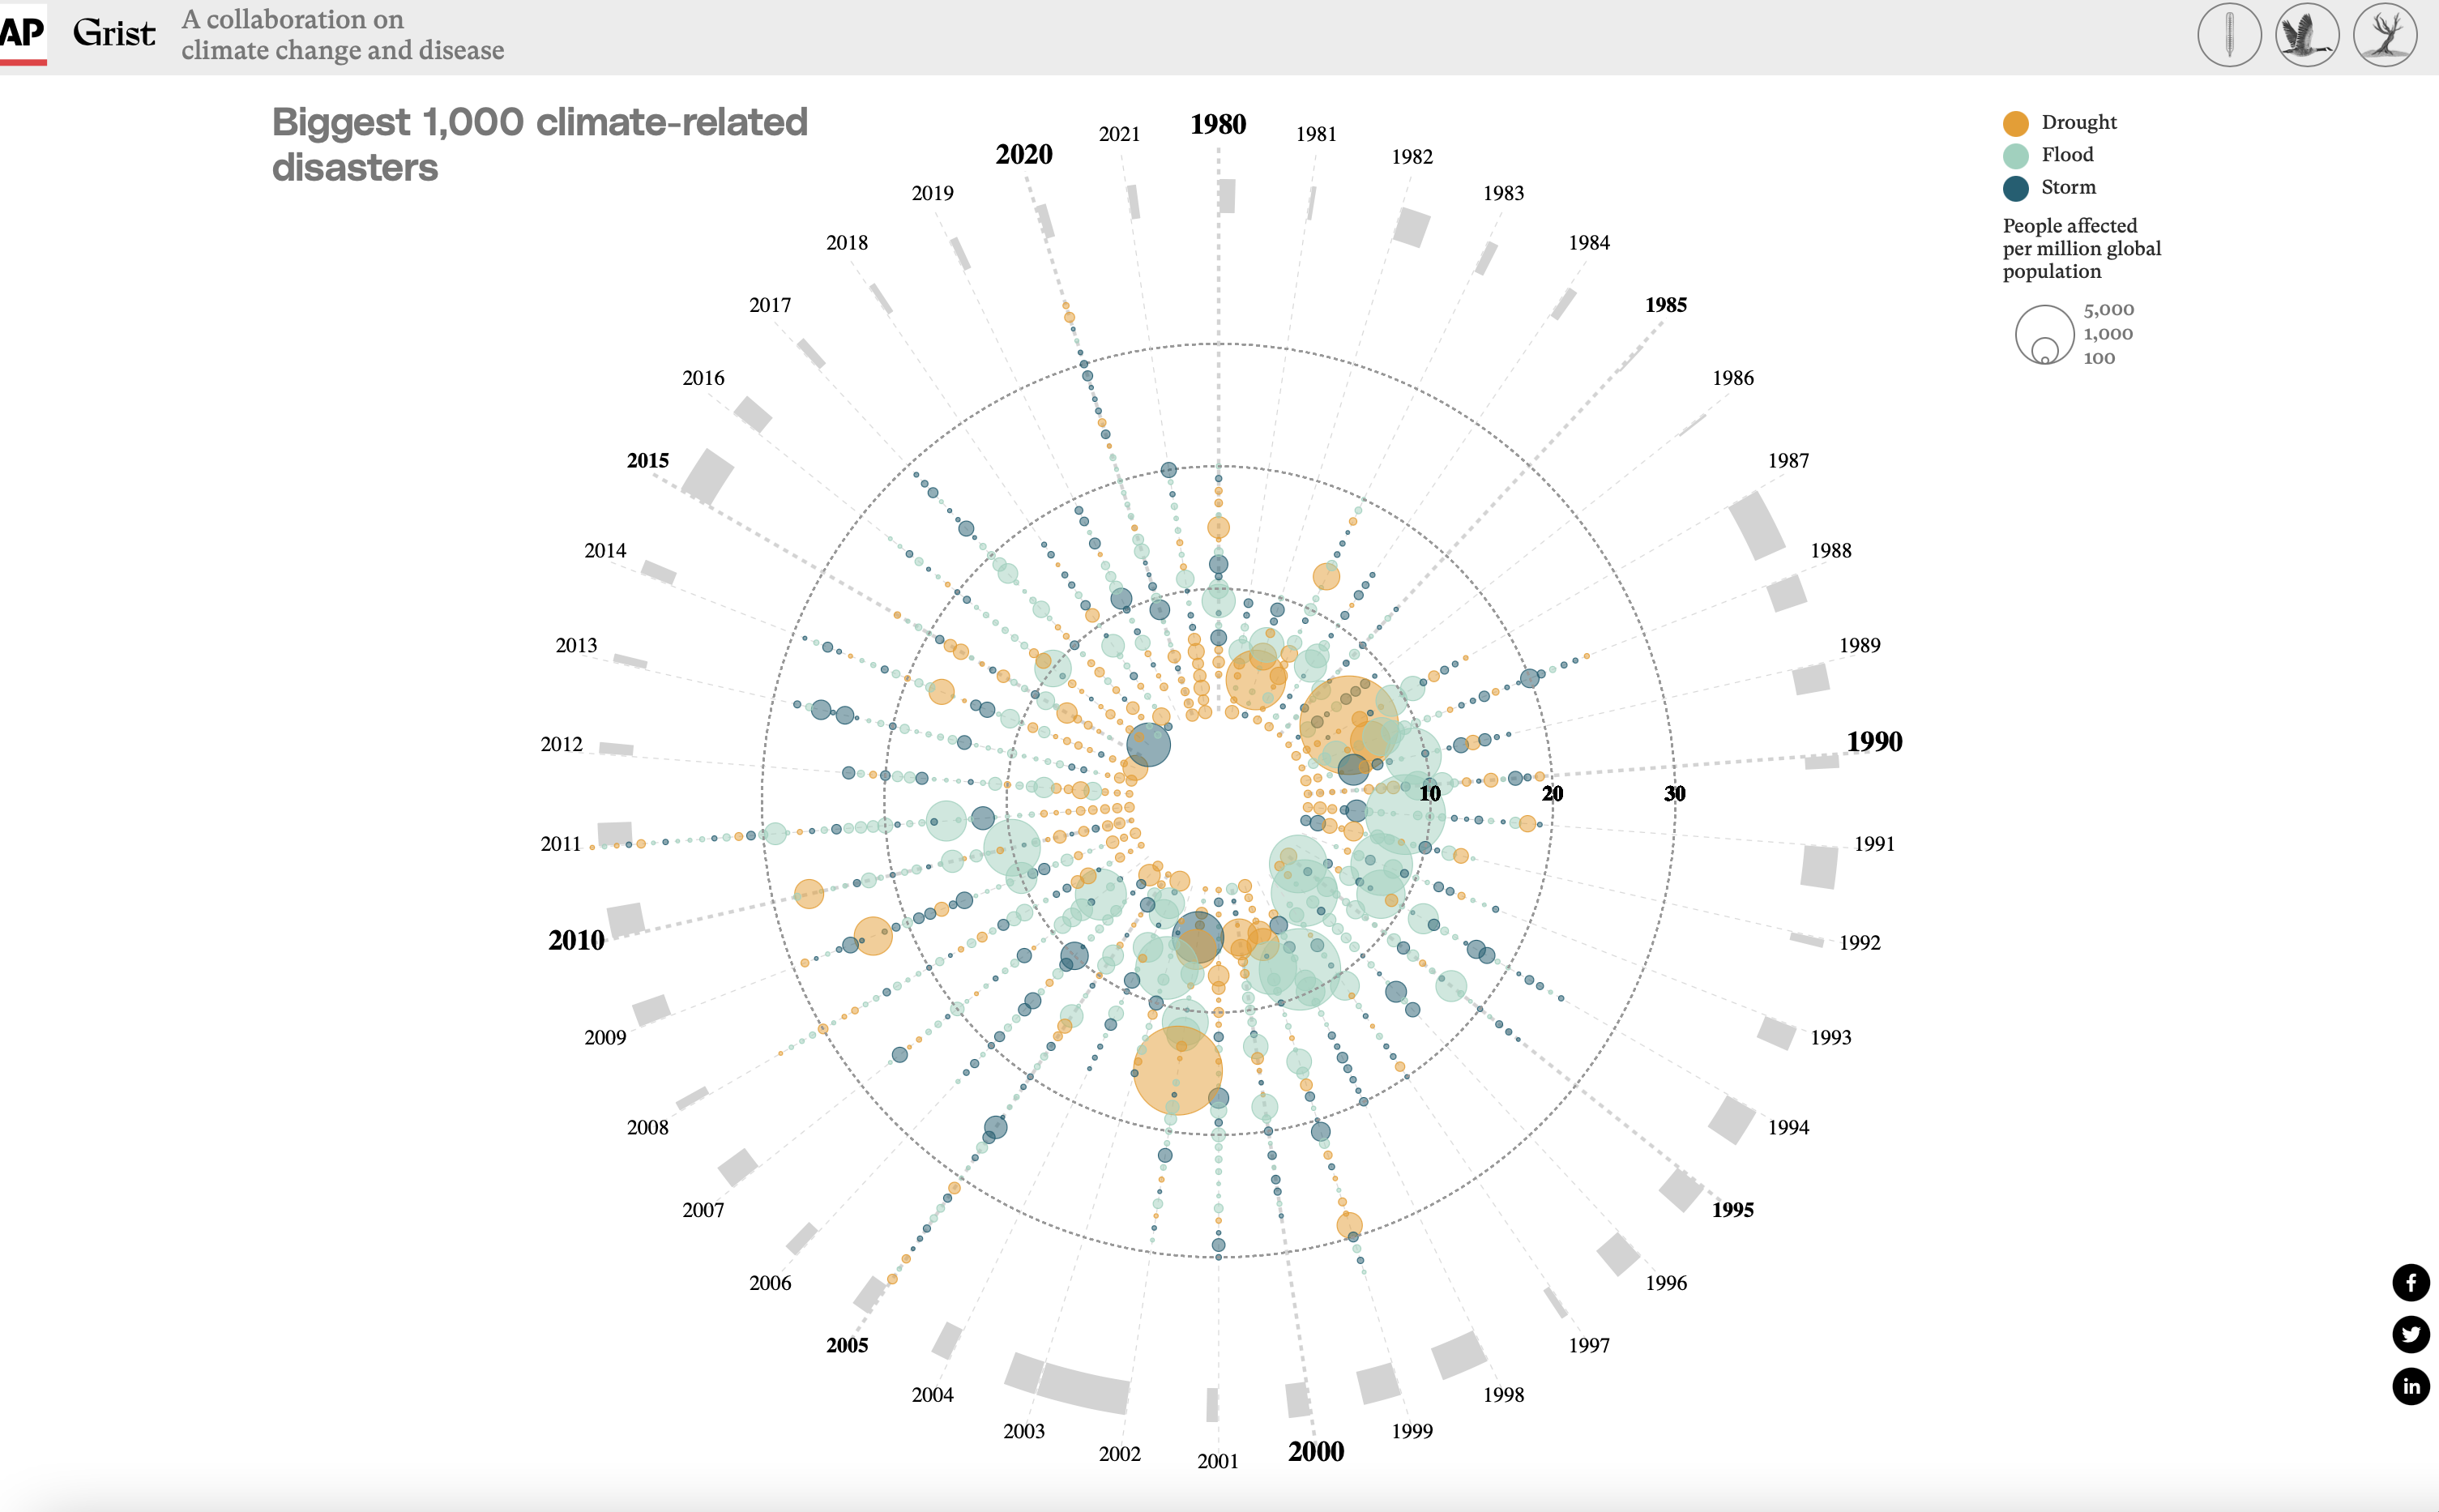
Visualization Critique

Visualization Critique

Visualization Critique

Visualization Critique

Coursekeeping

Coursekeeping
What do we have left to learn?
Making a model
How to get EVEN MORE control over your visualizations
Reaching your audience
Coursekeeping
Assignments remaining
2 labs and 1 coding assignment
Final project: the poster
Final project: the notebook
Activity: Make data happen
The remainder of today’s session will be dedicated to making sure you have some data in working form to start building your final projects.
Create a file system for your final project and start a Quarto document for your project.
Before you leave today, have at least one of your datasets in a state that it can be read into R and explored. You will need this to complete next week’s lab!
If you have questions about your project, now is a good time to ask!