Environmental Data Analysis and Visualization
Visualization critique
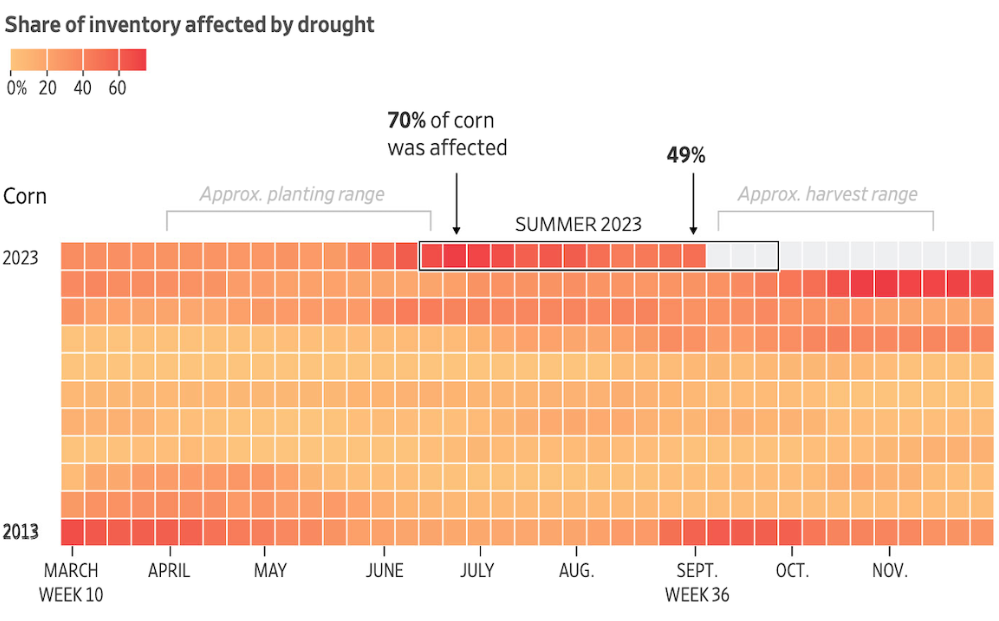
Visualization critique
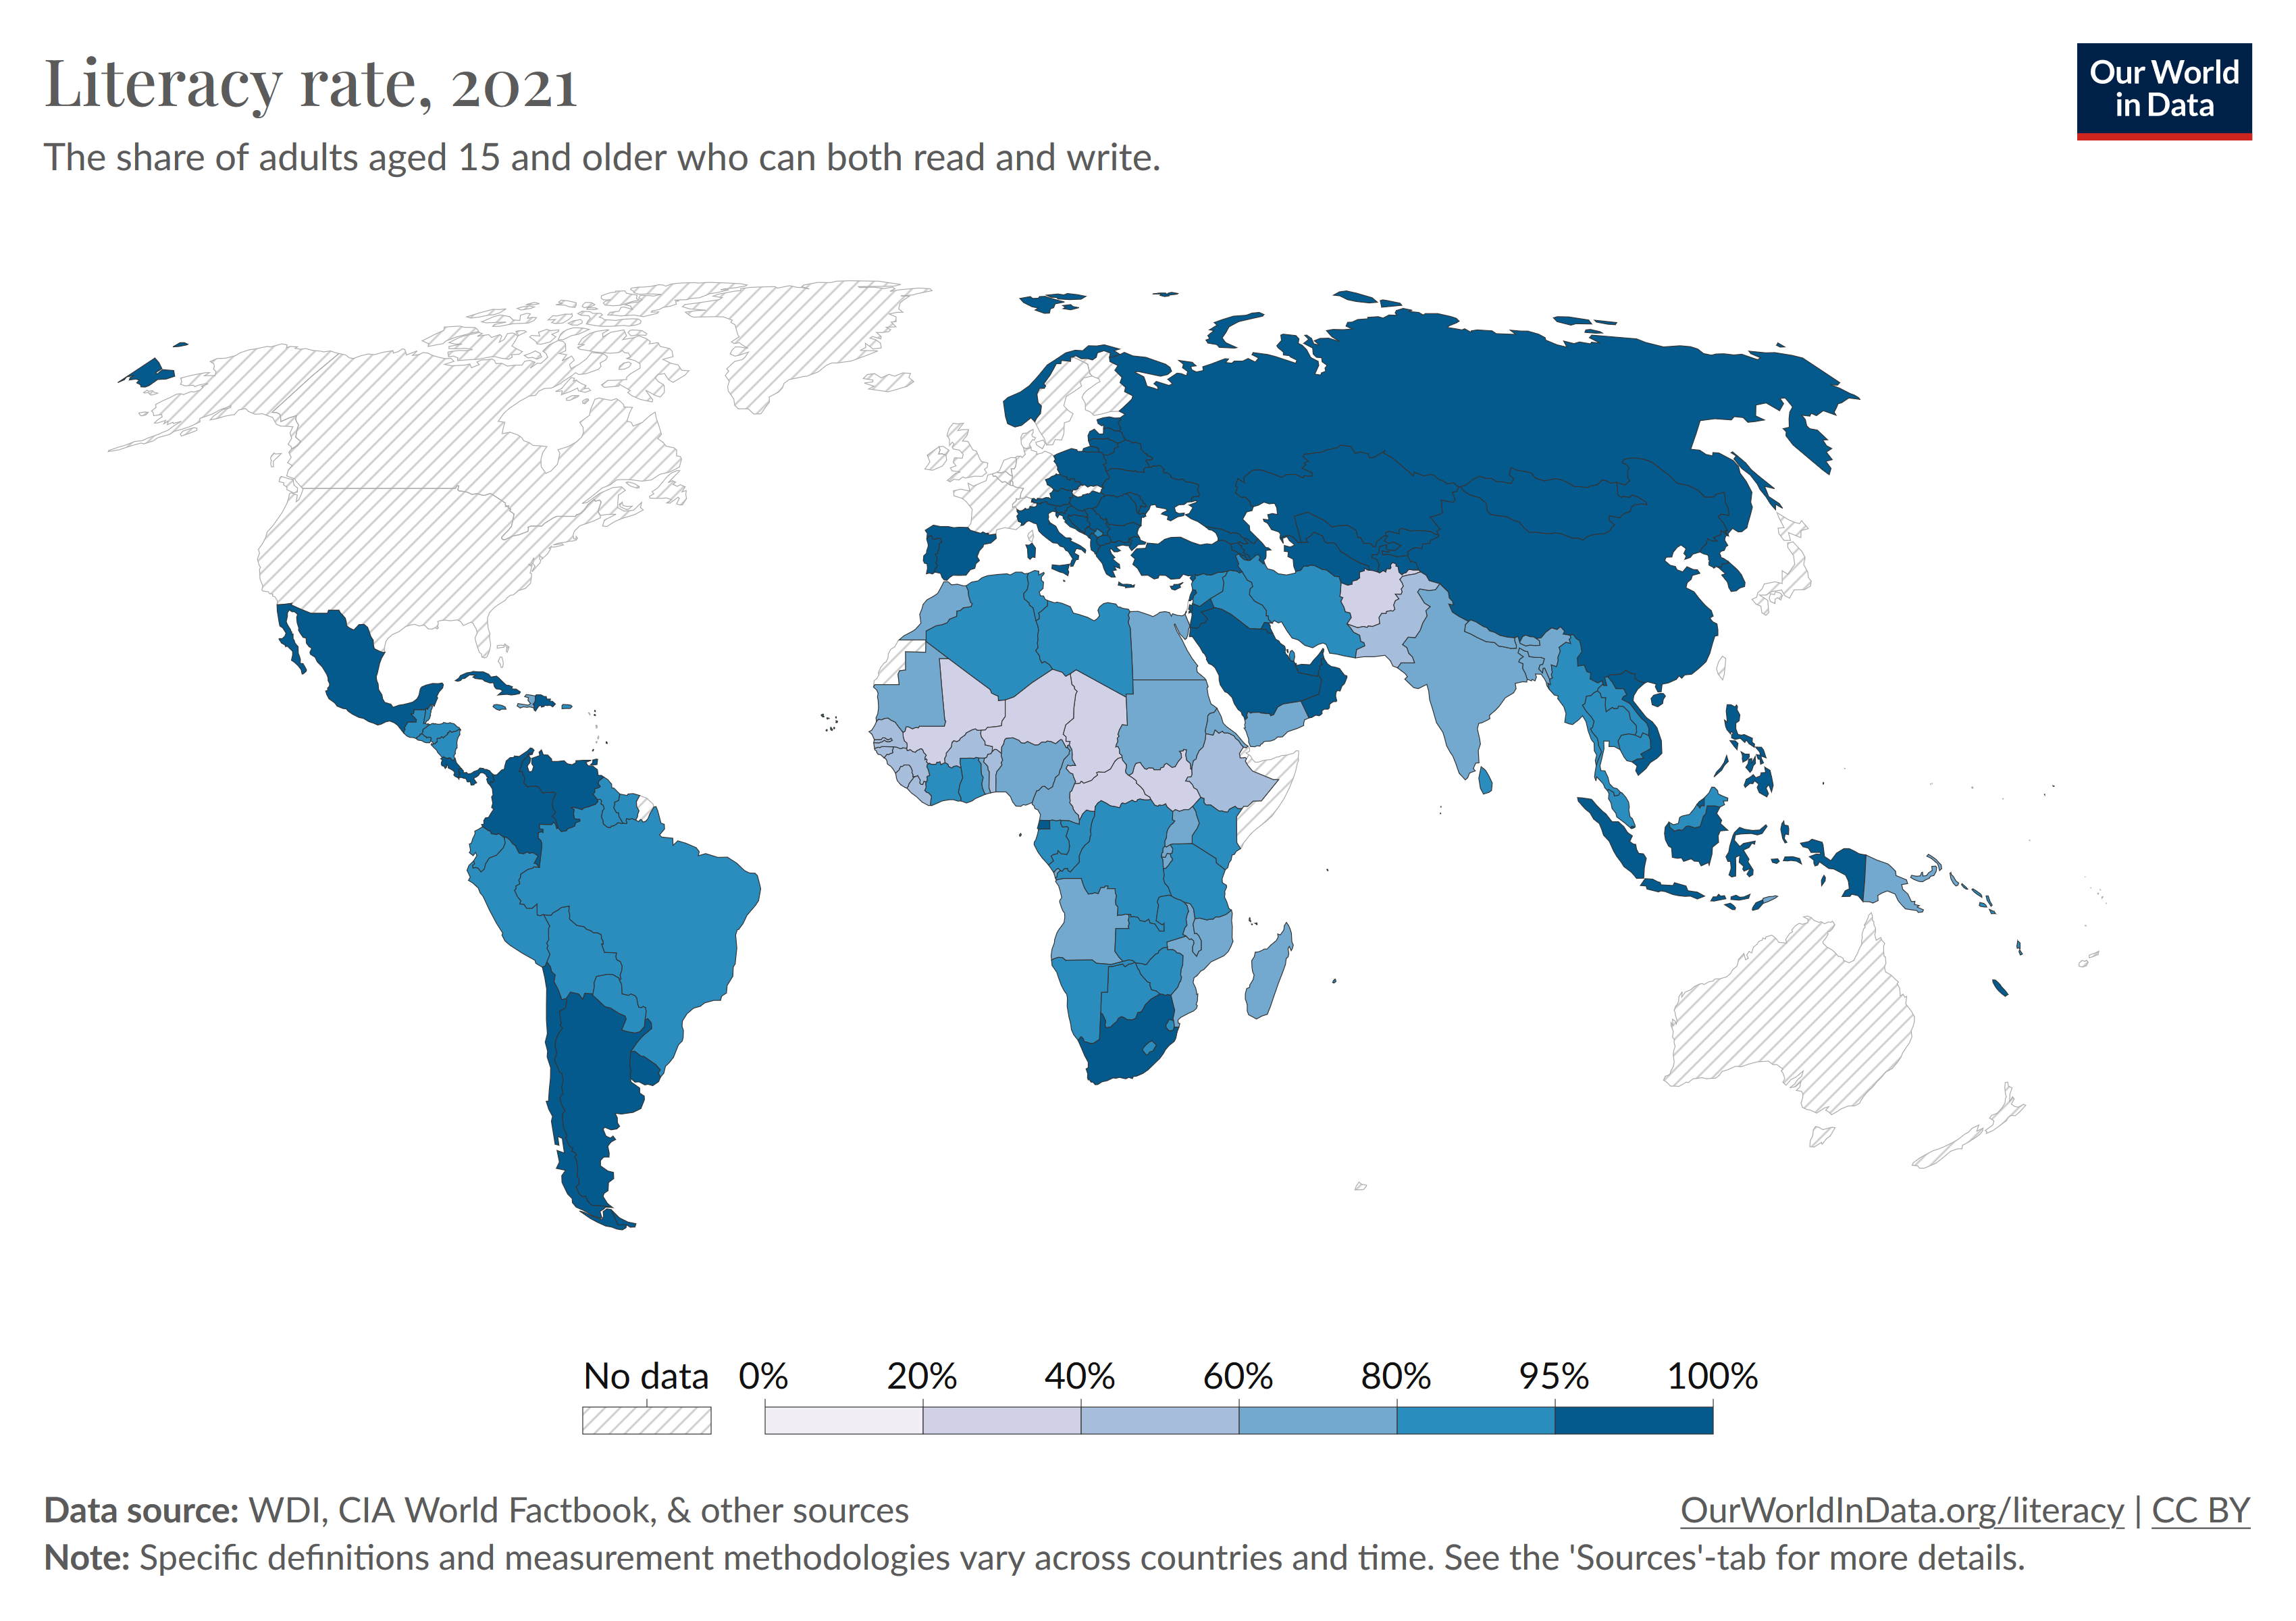
Visualization critique
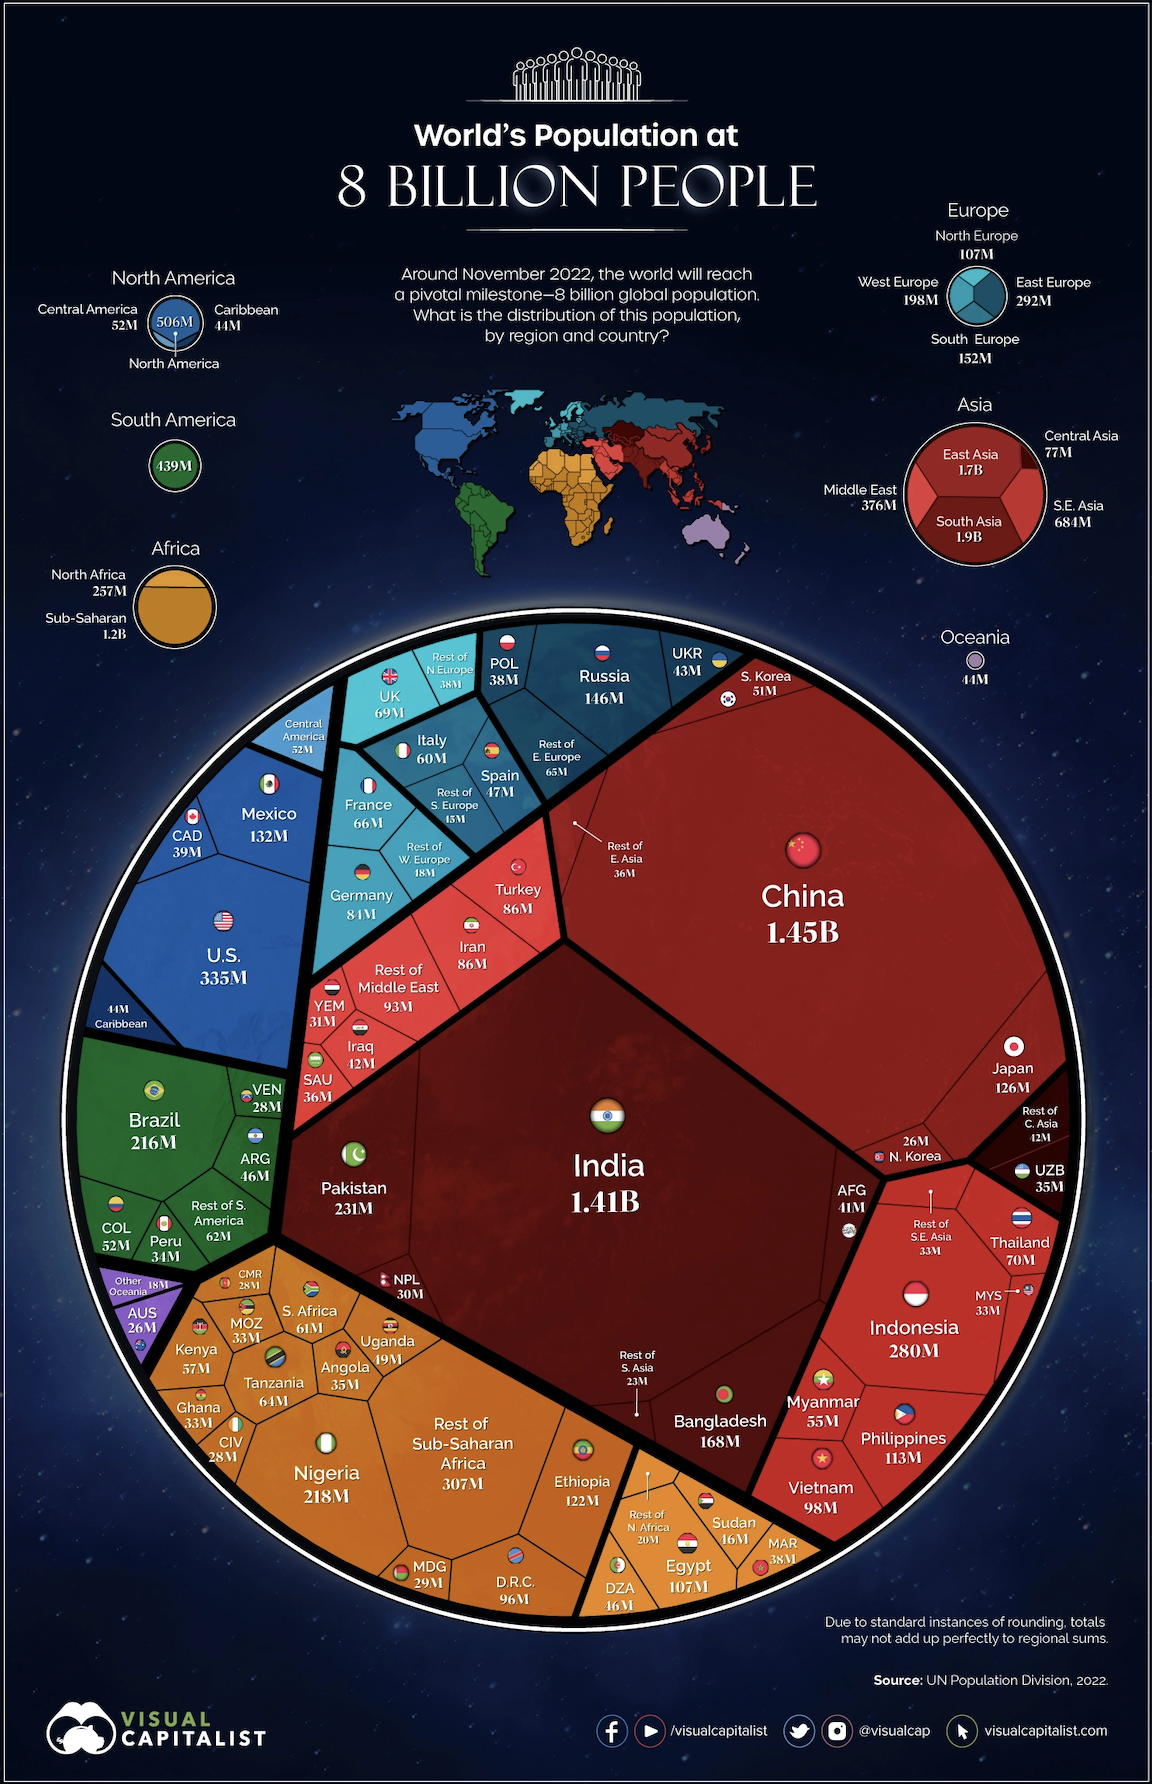
Linear modeling
Unlike hypothesis tests, we are often making judgement calls about how well a model fits the data.
Linear modeling

Testing assumptions
Linearity: The relationship between X and the mean of Y is linear.

If plot is flat-ish, we can proceed…
Testing assumptions
Normality: For any fixed value of X, Y is normally distributed.

If plot mostly adheres to diagonal line, we can proceed..
Testing assumptions
Homoscedasticity: The variance of residual is the same for any value of X.

If plot is mostly flat, we can proceed..
Posters
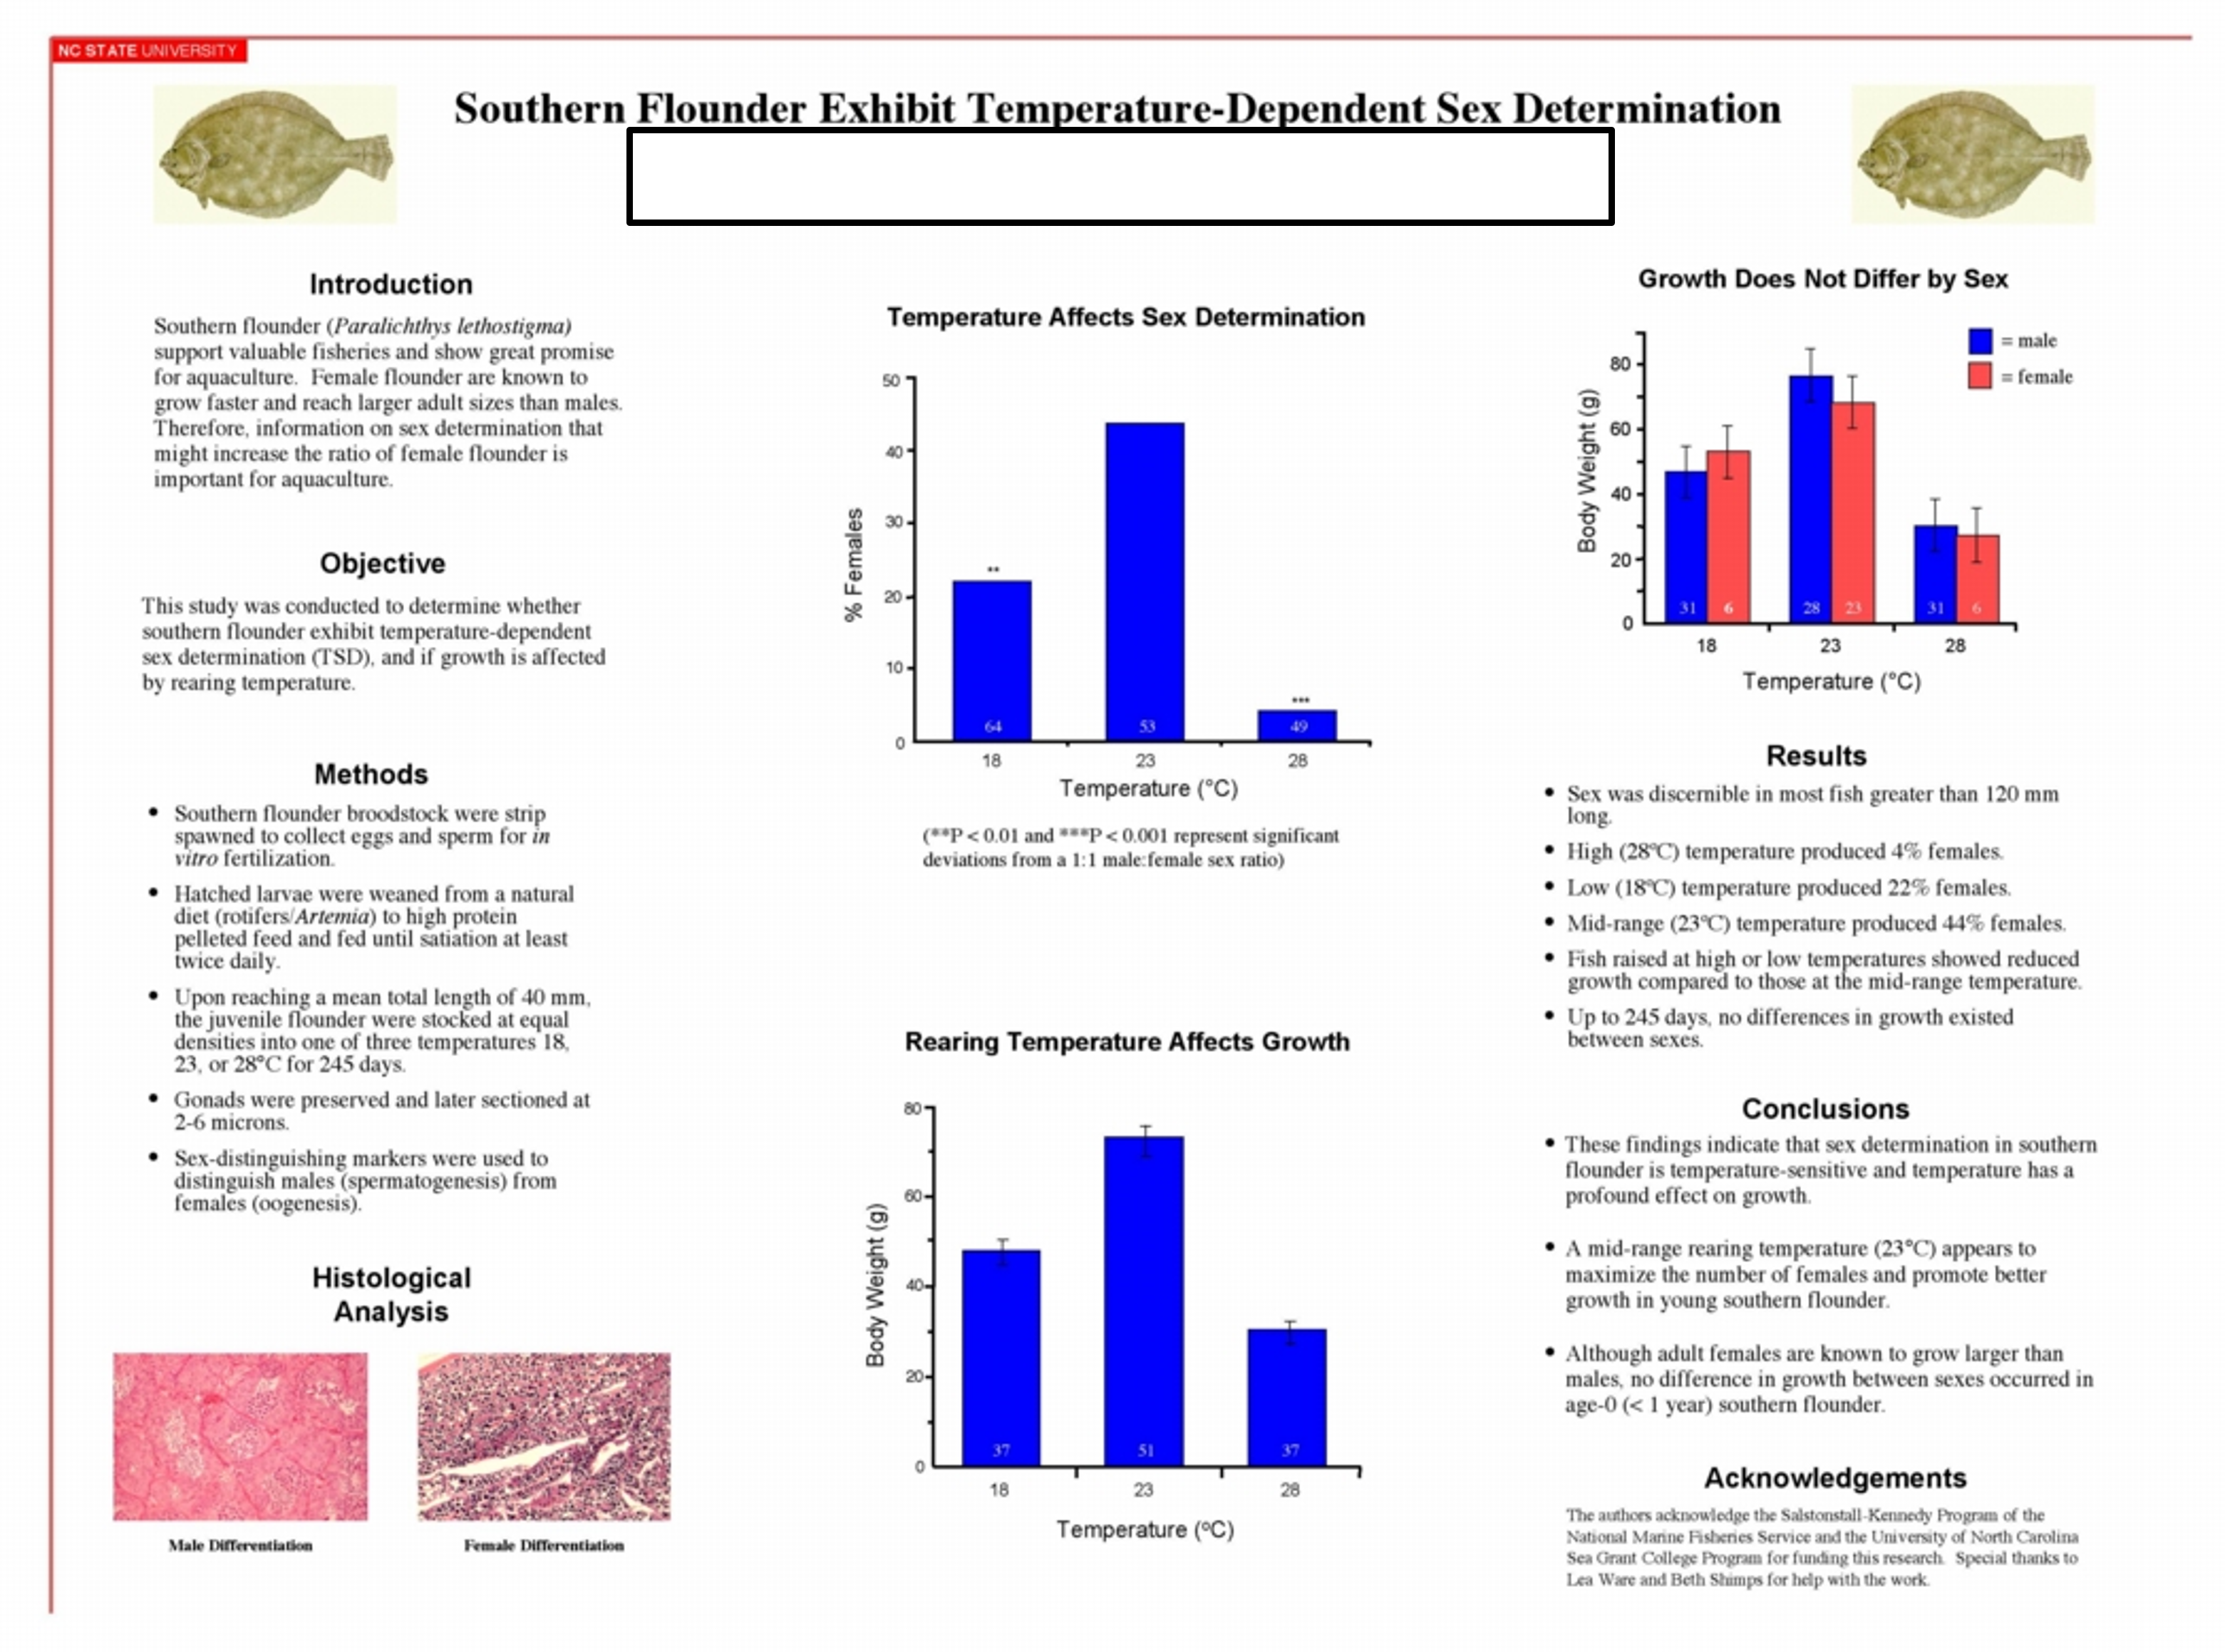
Make it readable
Show, don’t tell
Make it readable
Consistent and clean layout; context oriented in a single direction
Headings should clearly readable and convey the idea behind graphics or text sections
Graphic elements should be able to be seen from 10 feet away
Make it readable
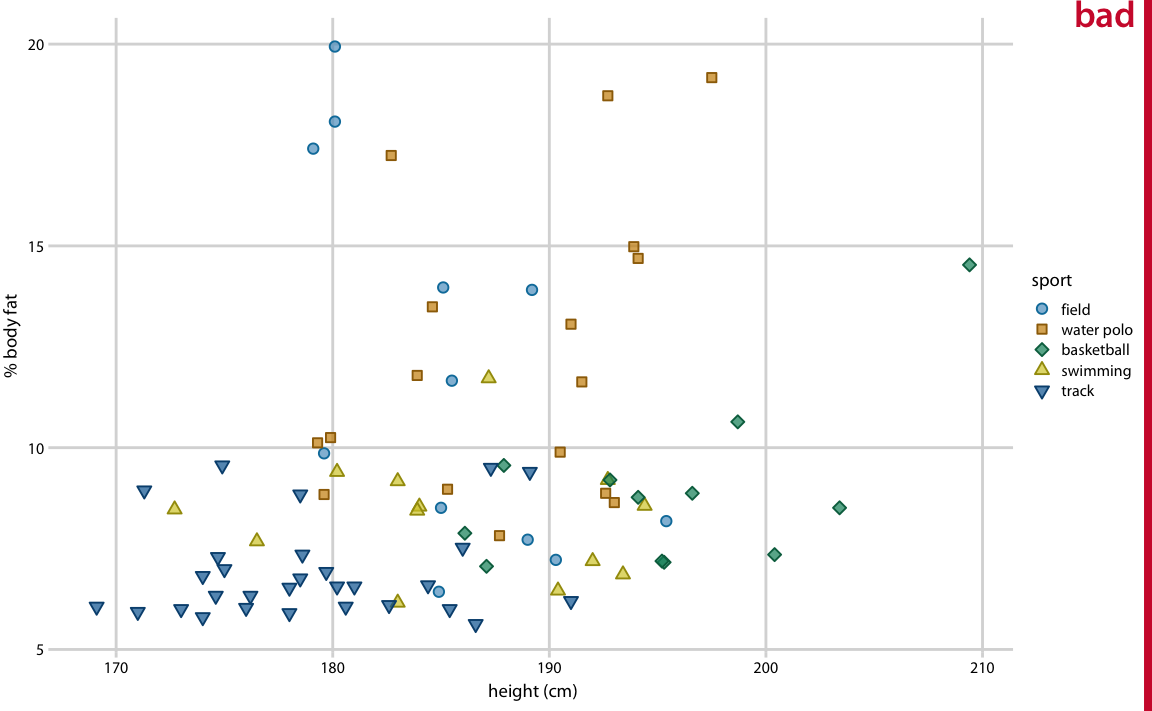
Wilke, Claus. 2019. Fundamentals of Data Visualization.
Make it readable
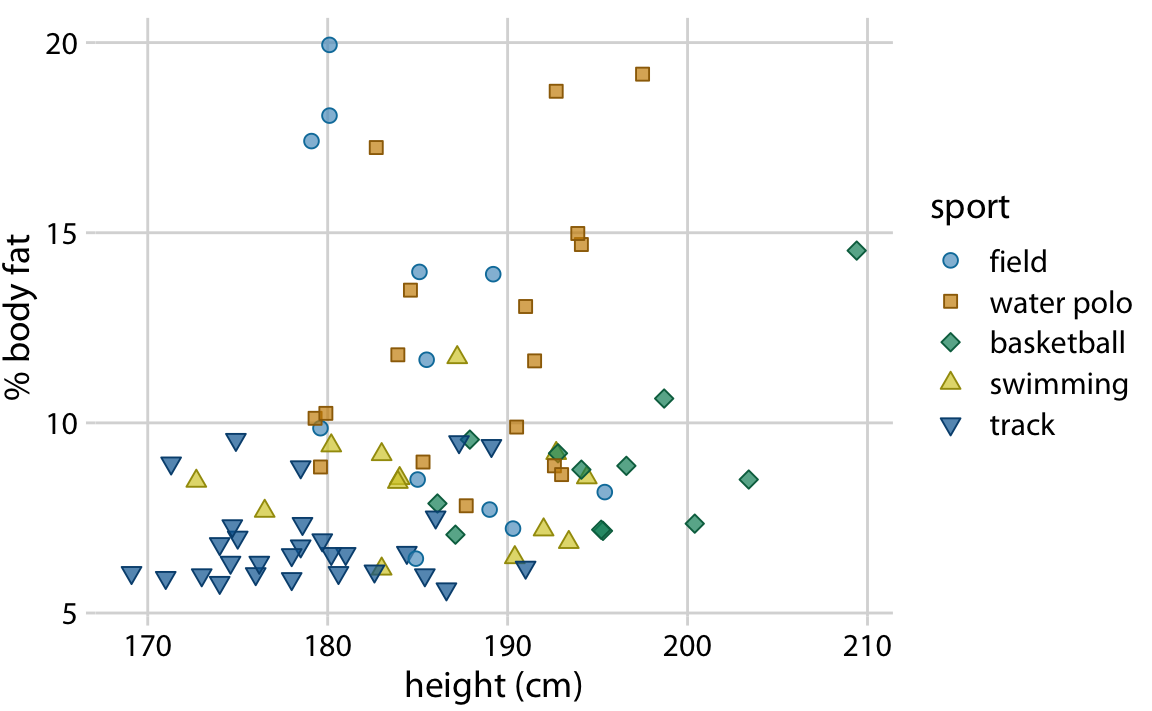
Wilke, Claus. 2019. Fundamentals of Data Visualization.
Make it readable
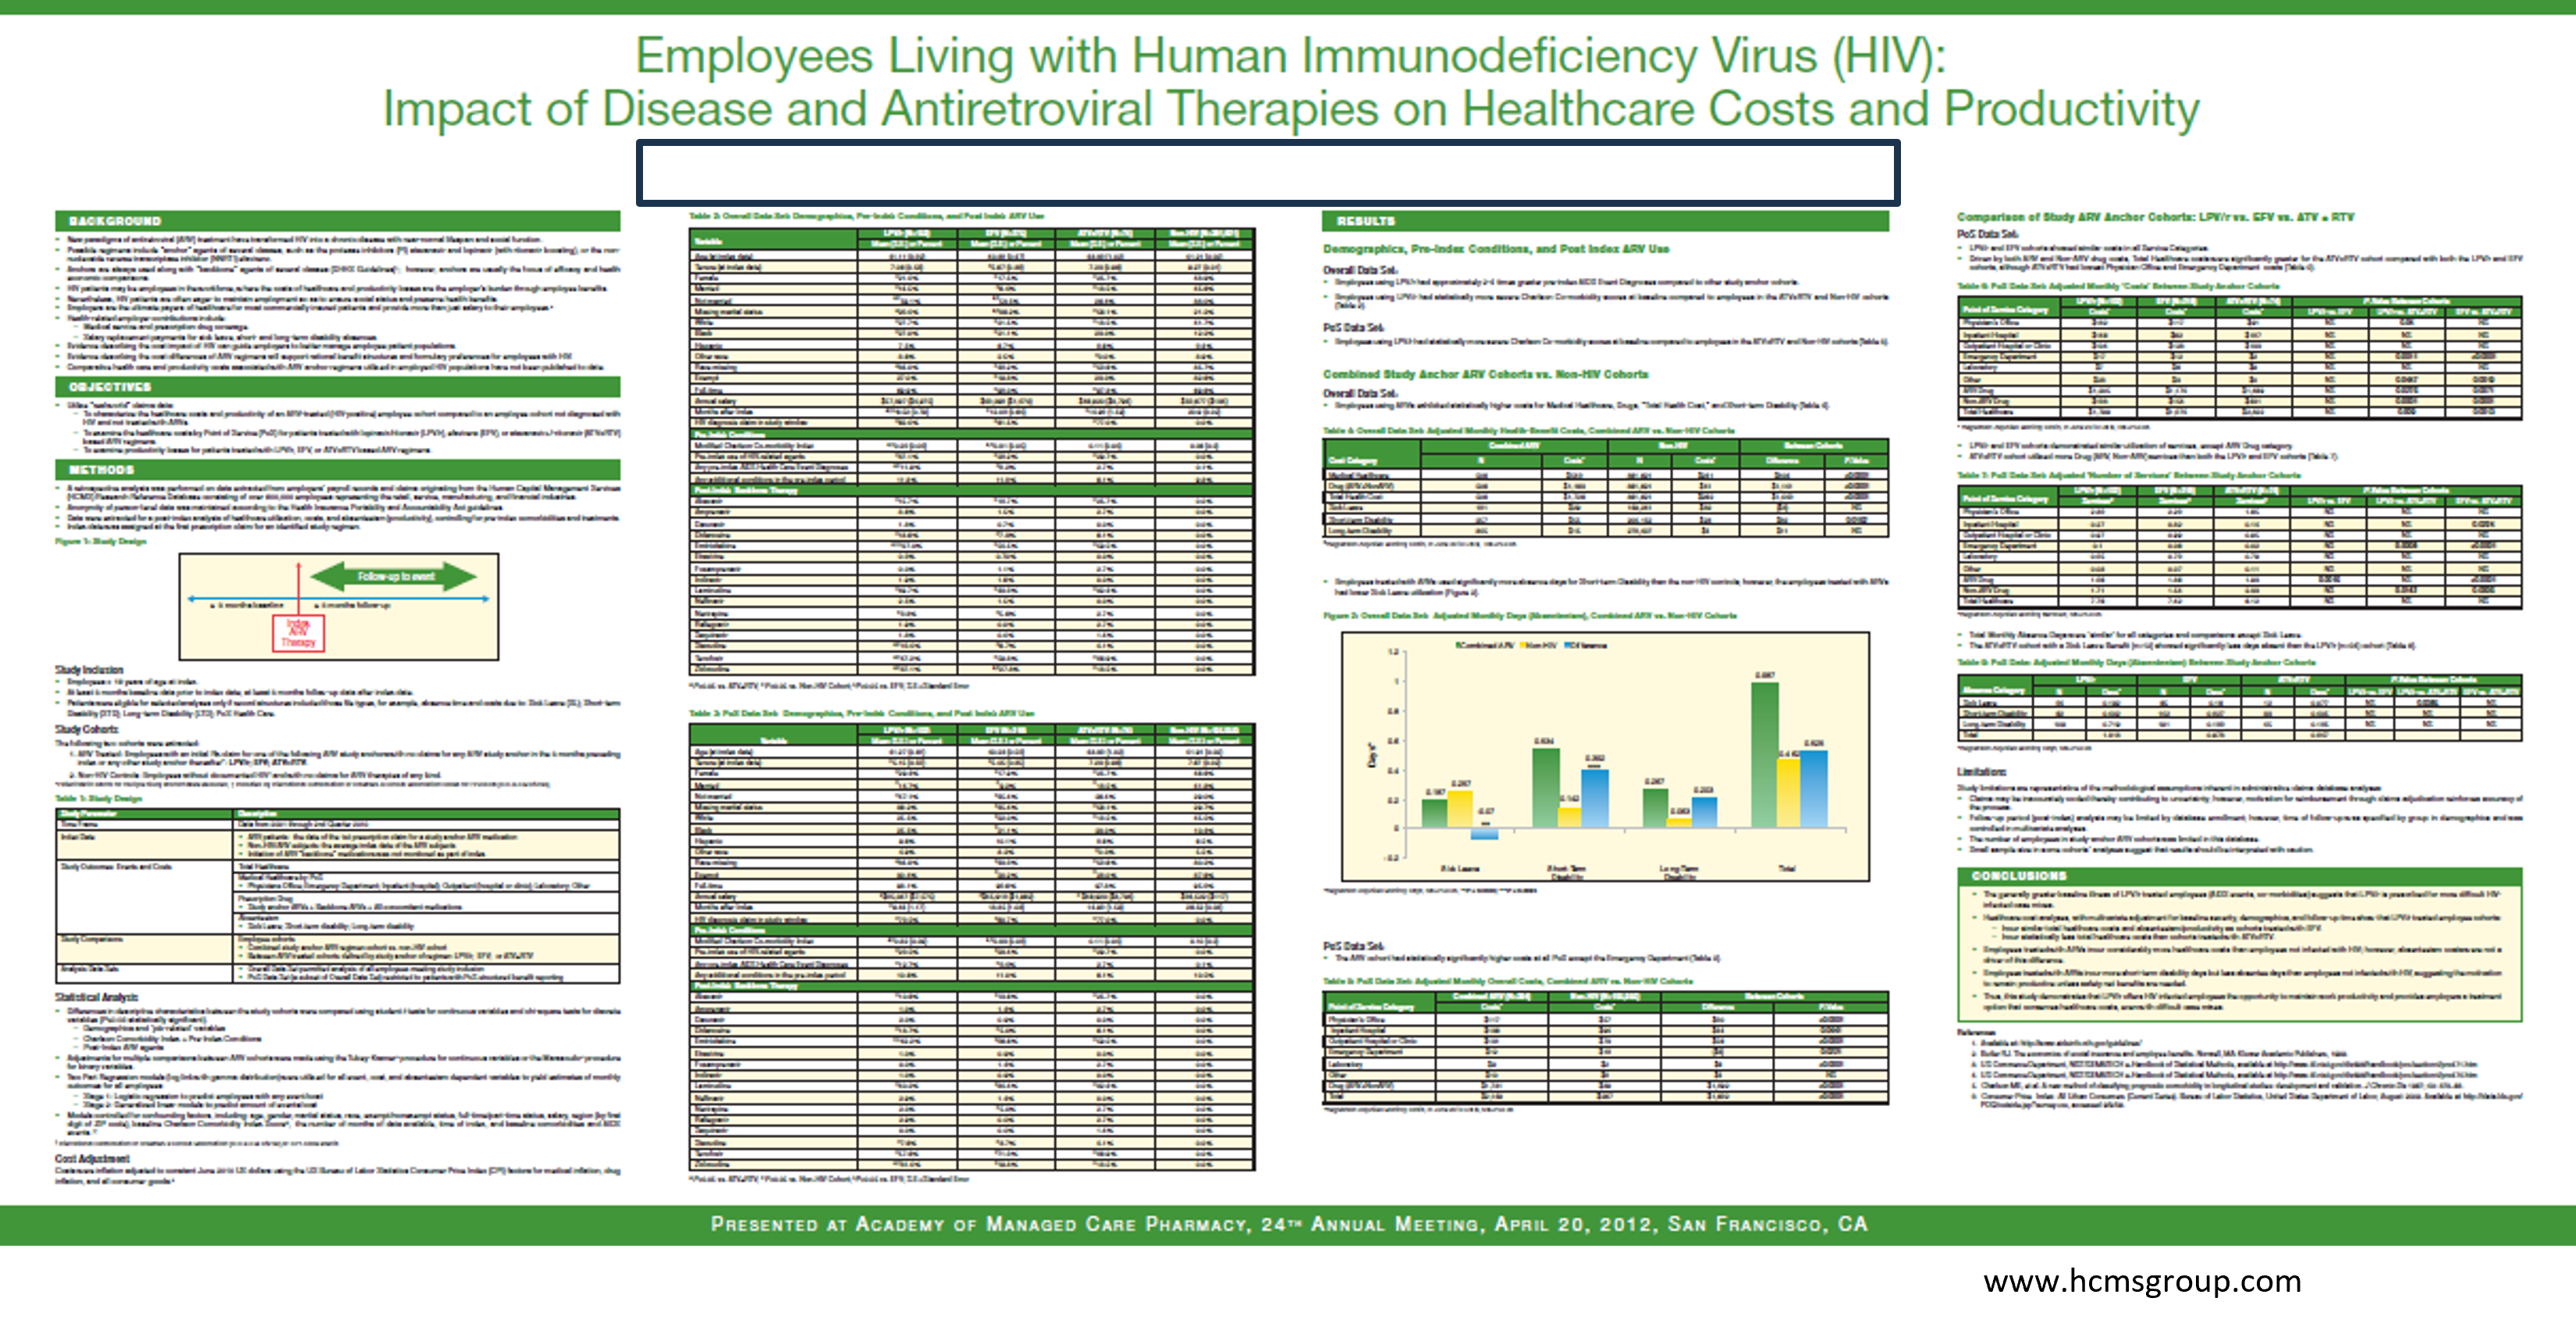
Make it readable
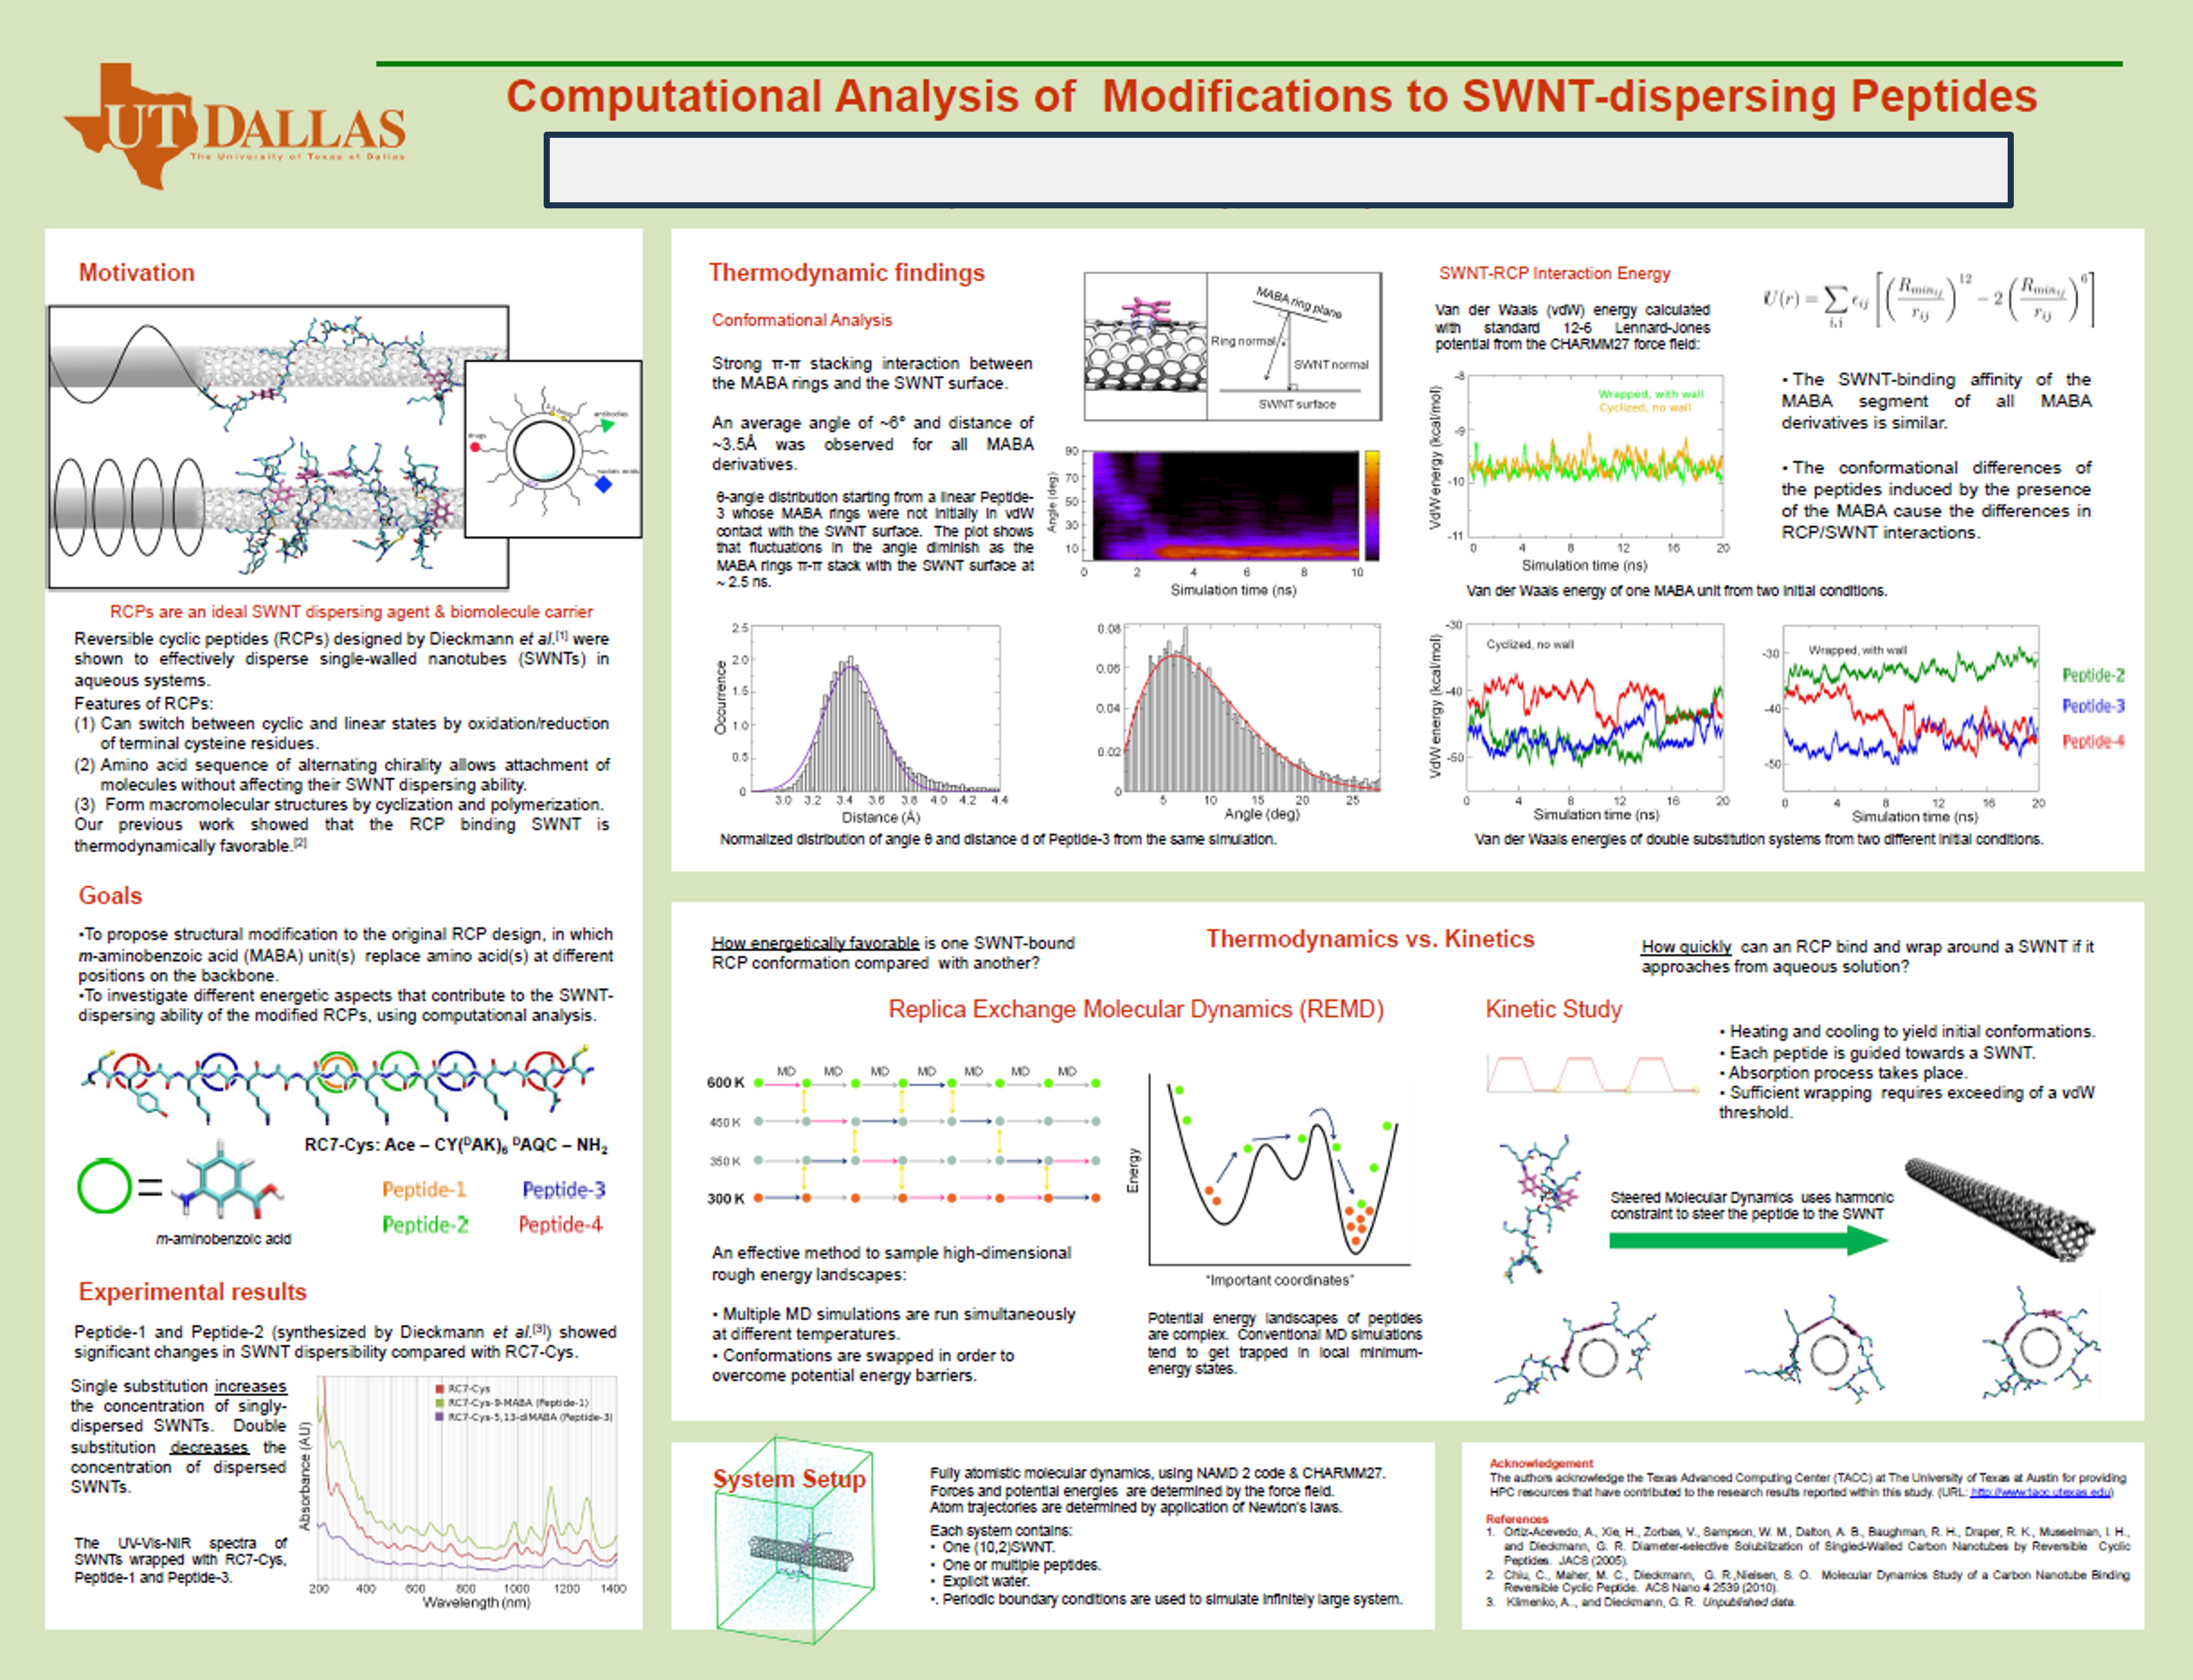
Show, don’t tell
Fewer words, bigger words
Limit use of text (800-1200 words max)
Graphics should be largely self-explantory
The poster is meant to come with an interpreter: you!
Show, don’t tell
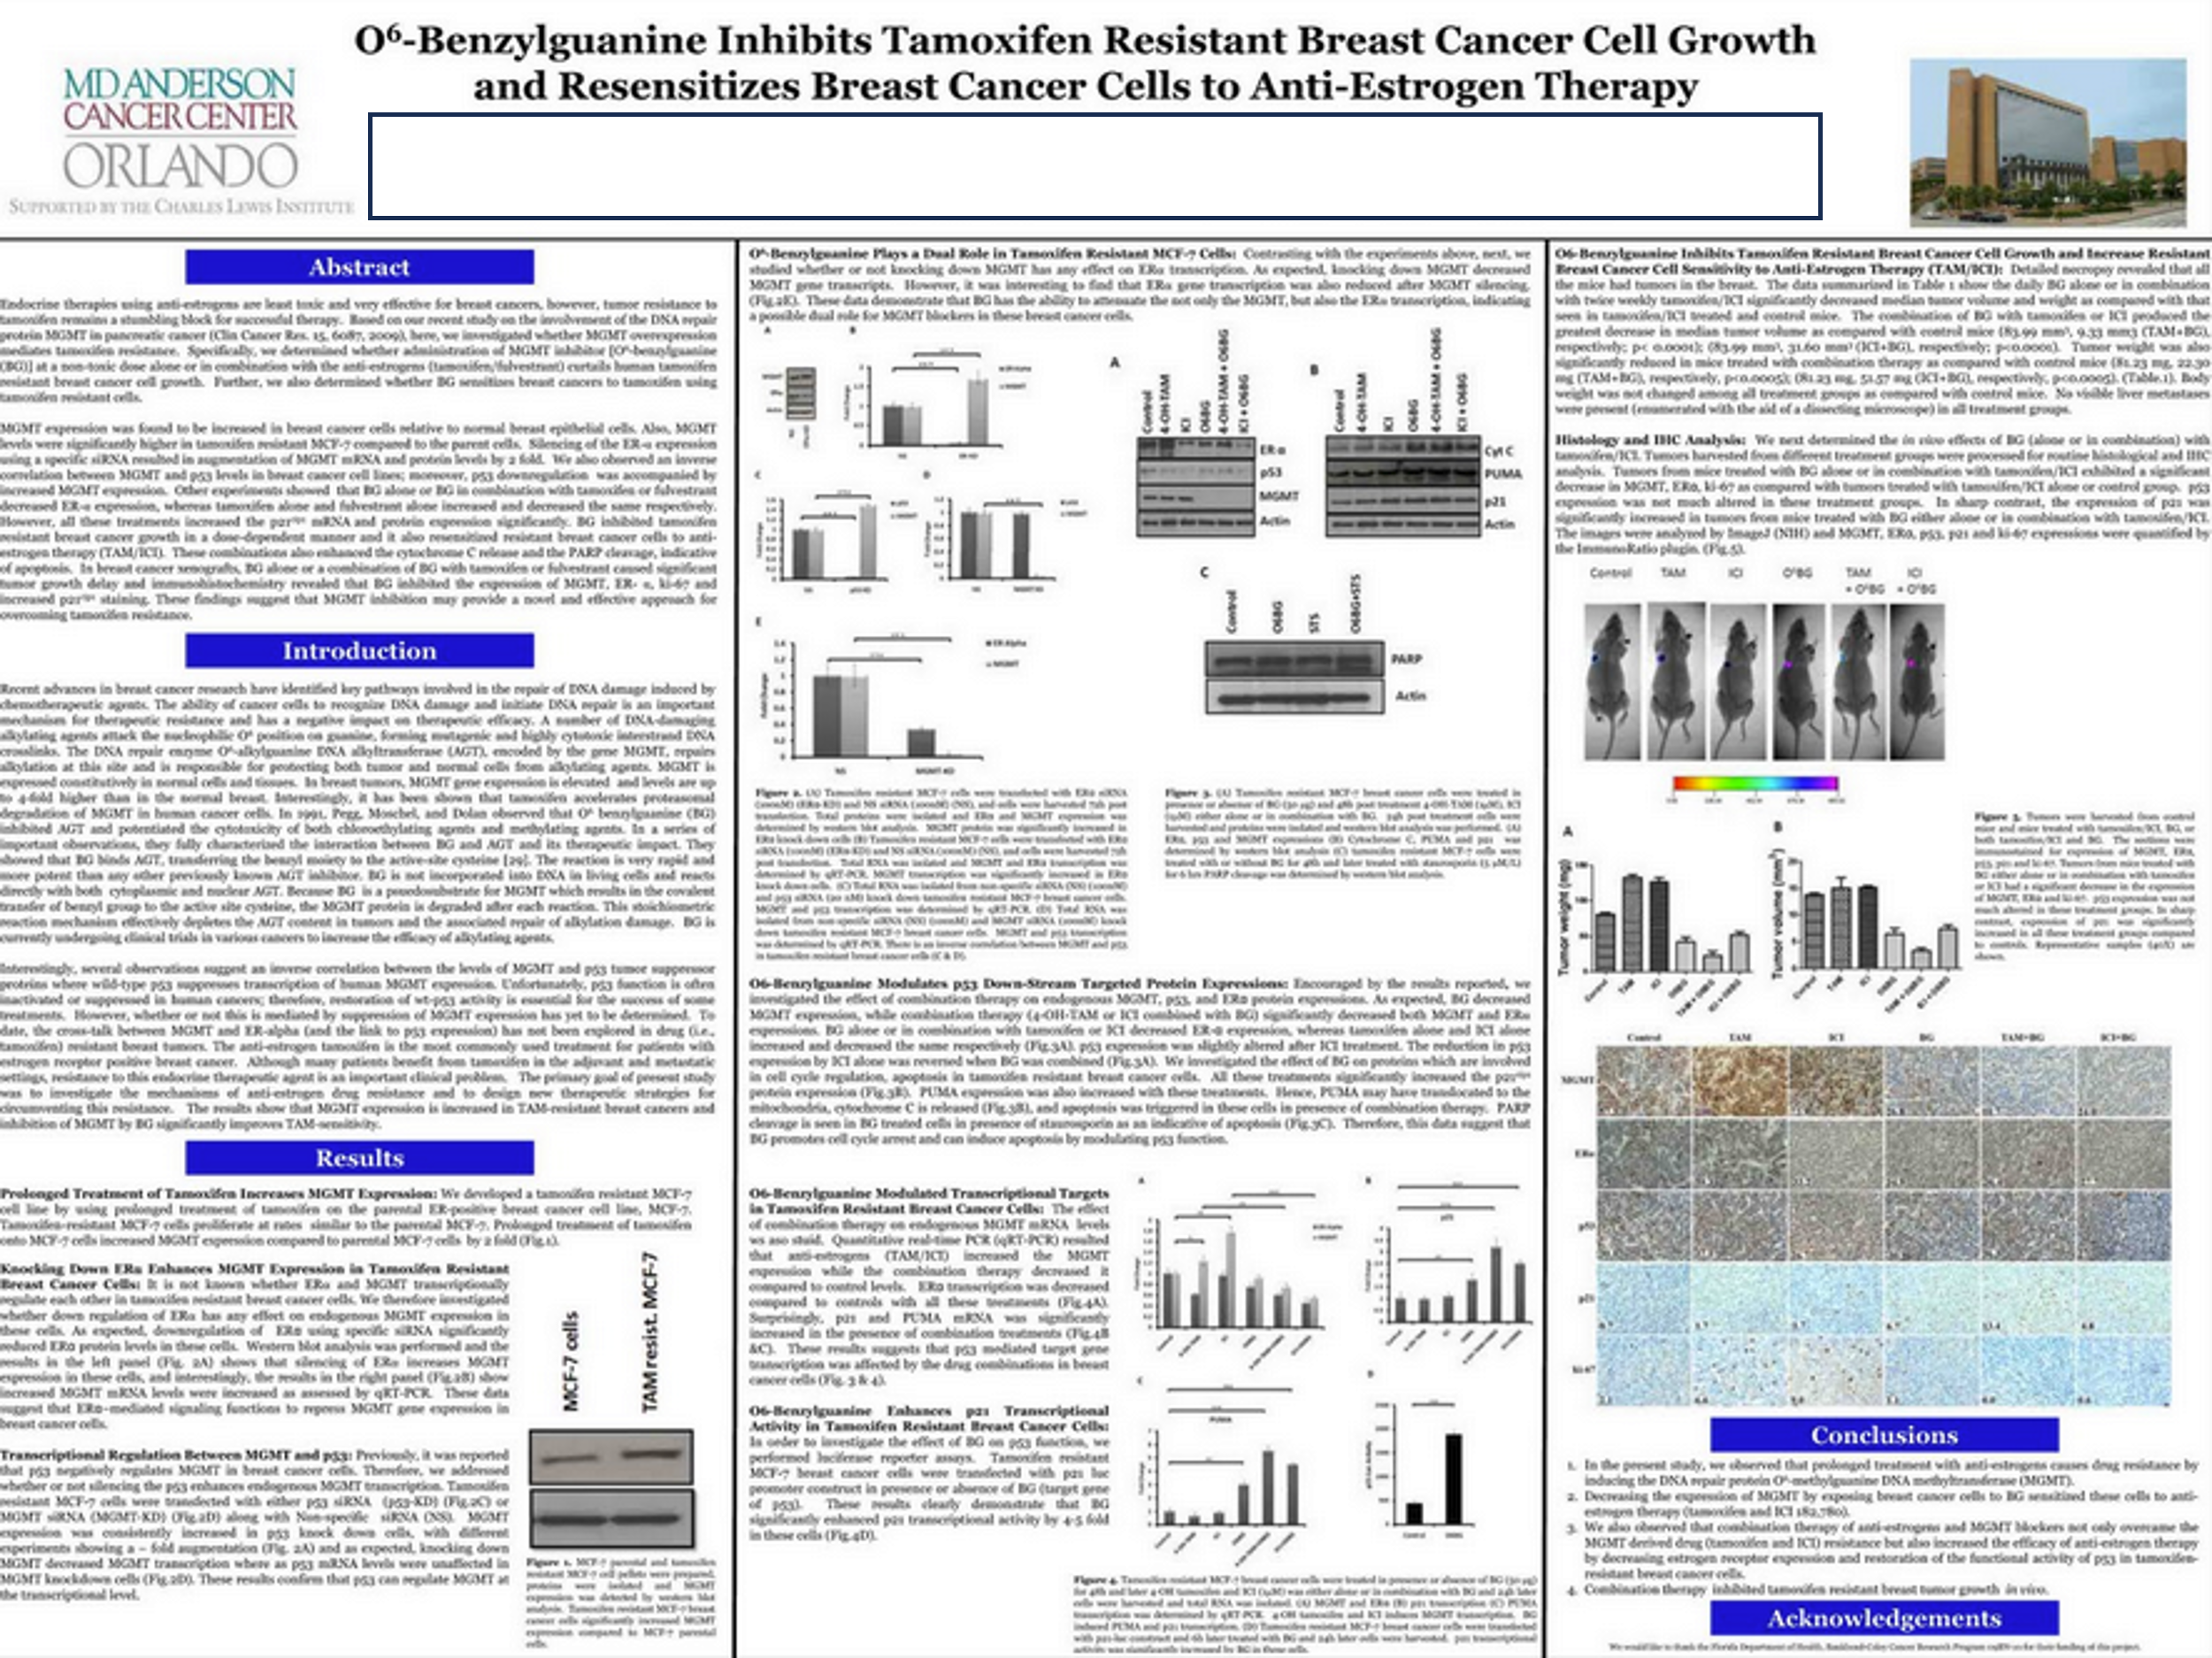
Show, don’t tell
Activity: Draft a poster
Find a poster template or build your own!
- You can use your preferred platform, or there is a PowerPoint template on Canvas
If you have any draft graphics, you can also add these in the appropriate places to beginning filling out the space
Poster size should be 36 in wide by 48 inches
Next week
Tuesday I will be holding final project consultations on Zoom between 10 AM and 1PM. A signup will be posted shortly.
If you need to discuss your project outside this time, please connect with me as soon as possible.
Have a great weekend and a great break!