Environmental Data Analysis and Visualization
Base plot
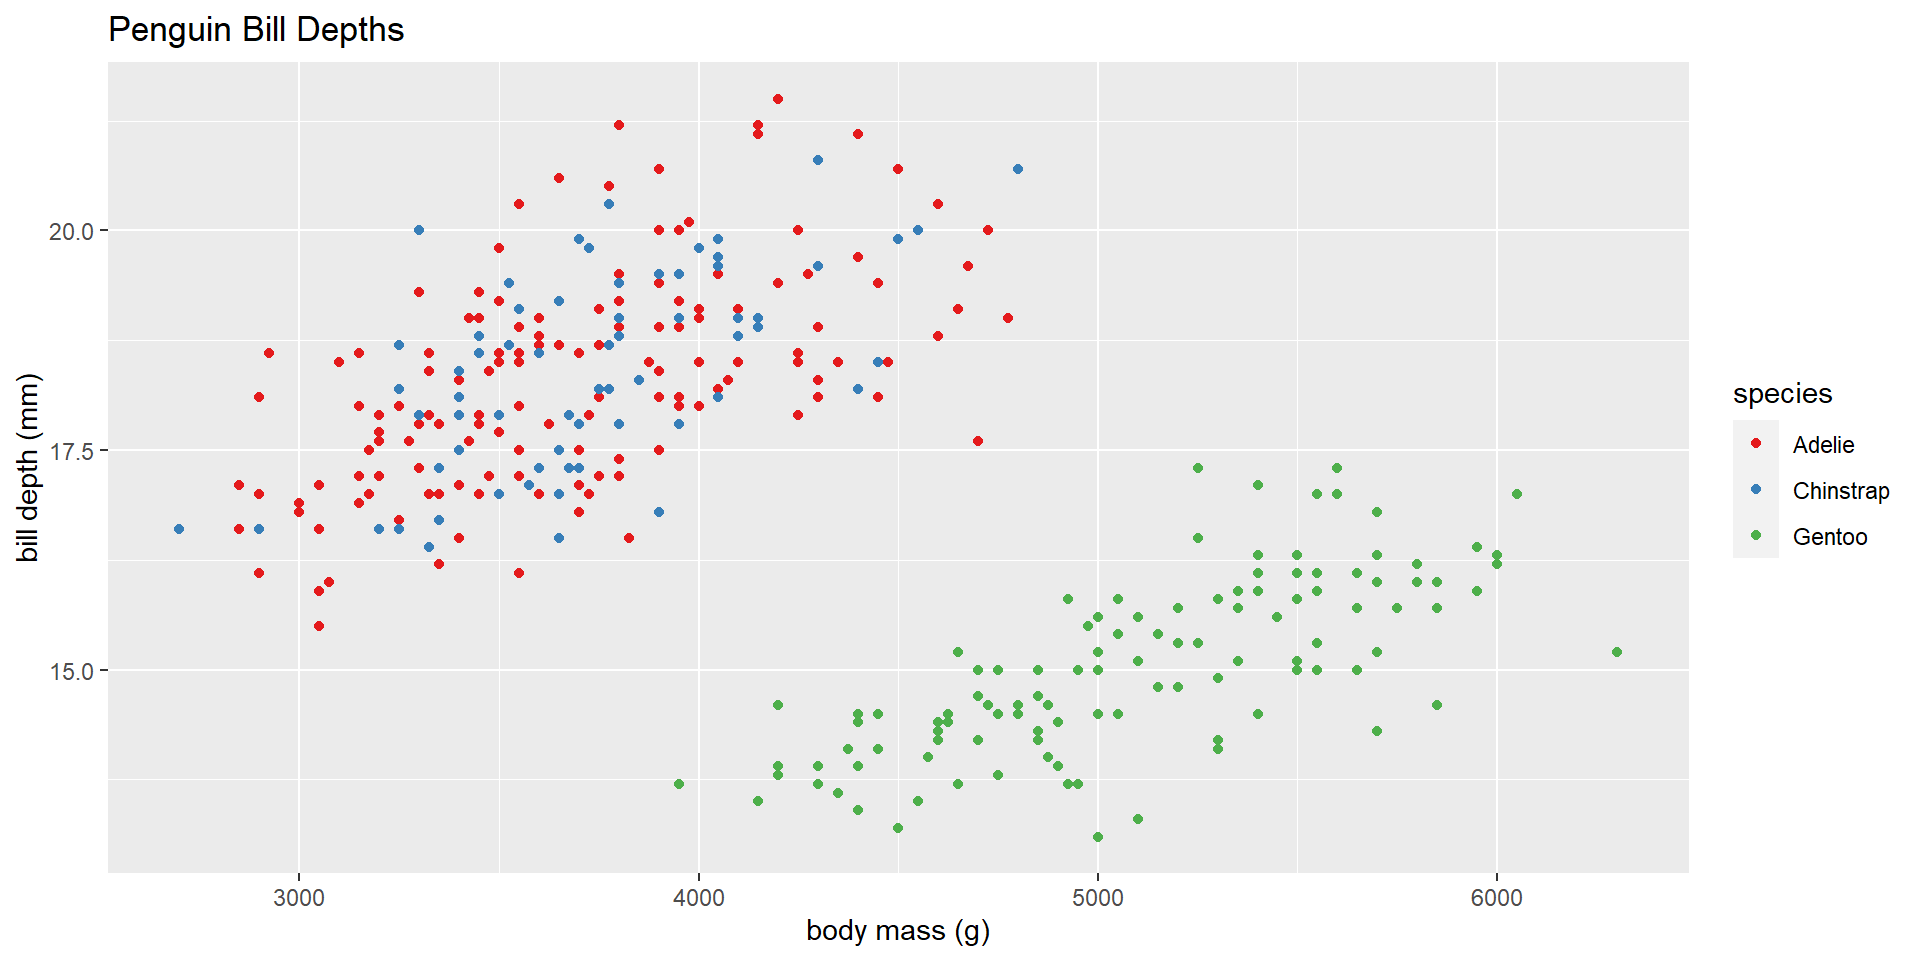
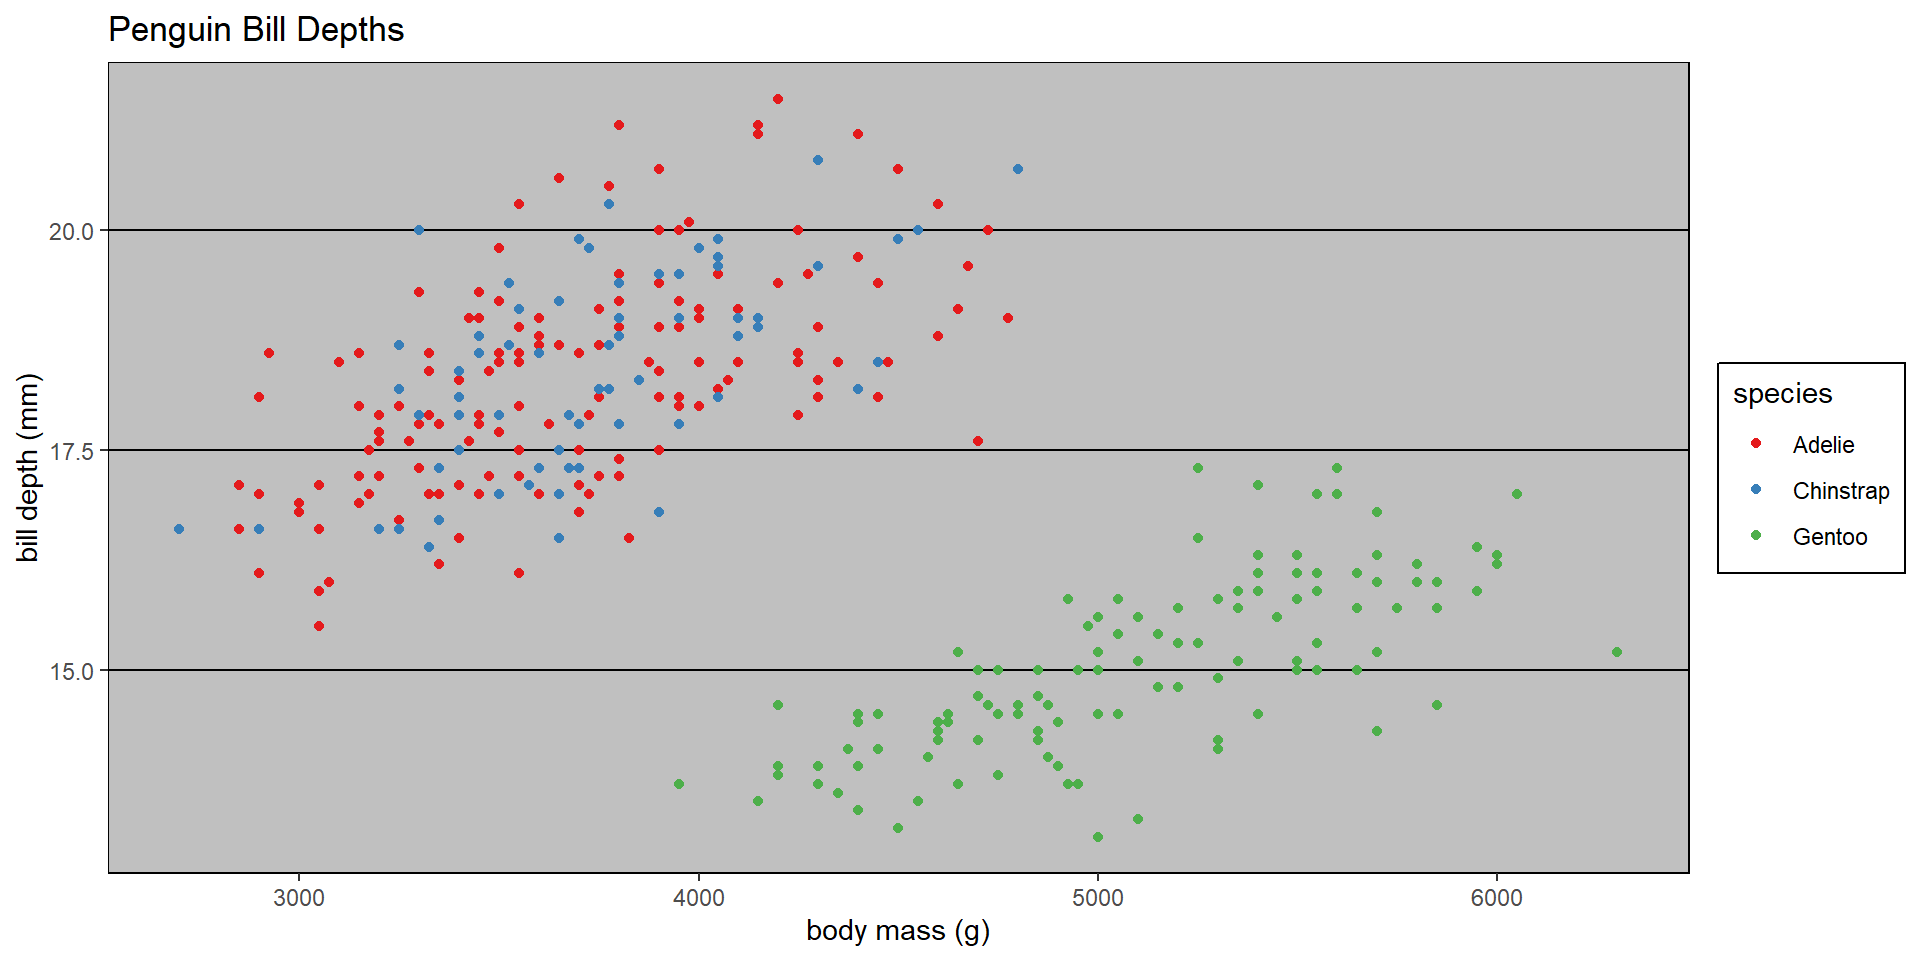
library (tidyverse)library (palmerpenguins)<- ggplot (drop_na (penguins),aes (x= body_mass_g,y= bill_depth_mm,color= species)) + geom_point () + scale_colour_brewer (palette = "Set1" ) + labs (x= "body mass (g)" ,y= "bill depth (mm)" ,title= "Penguin Bill Depths" )
Base plot
Using complete themes
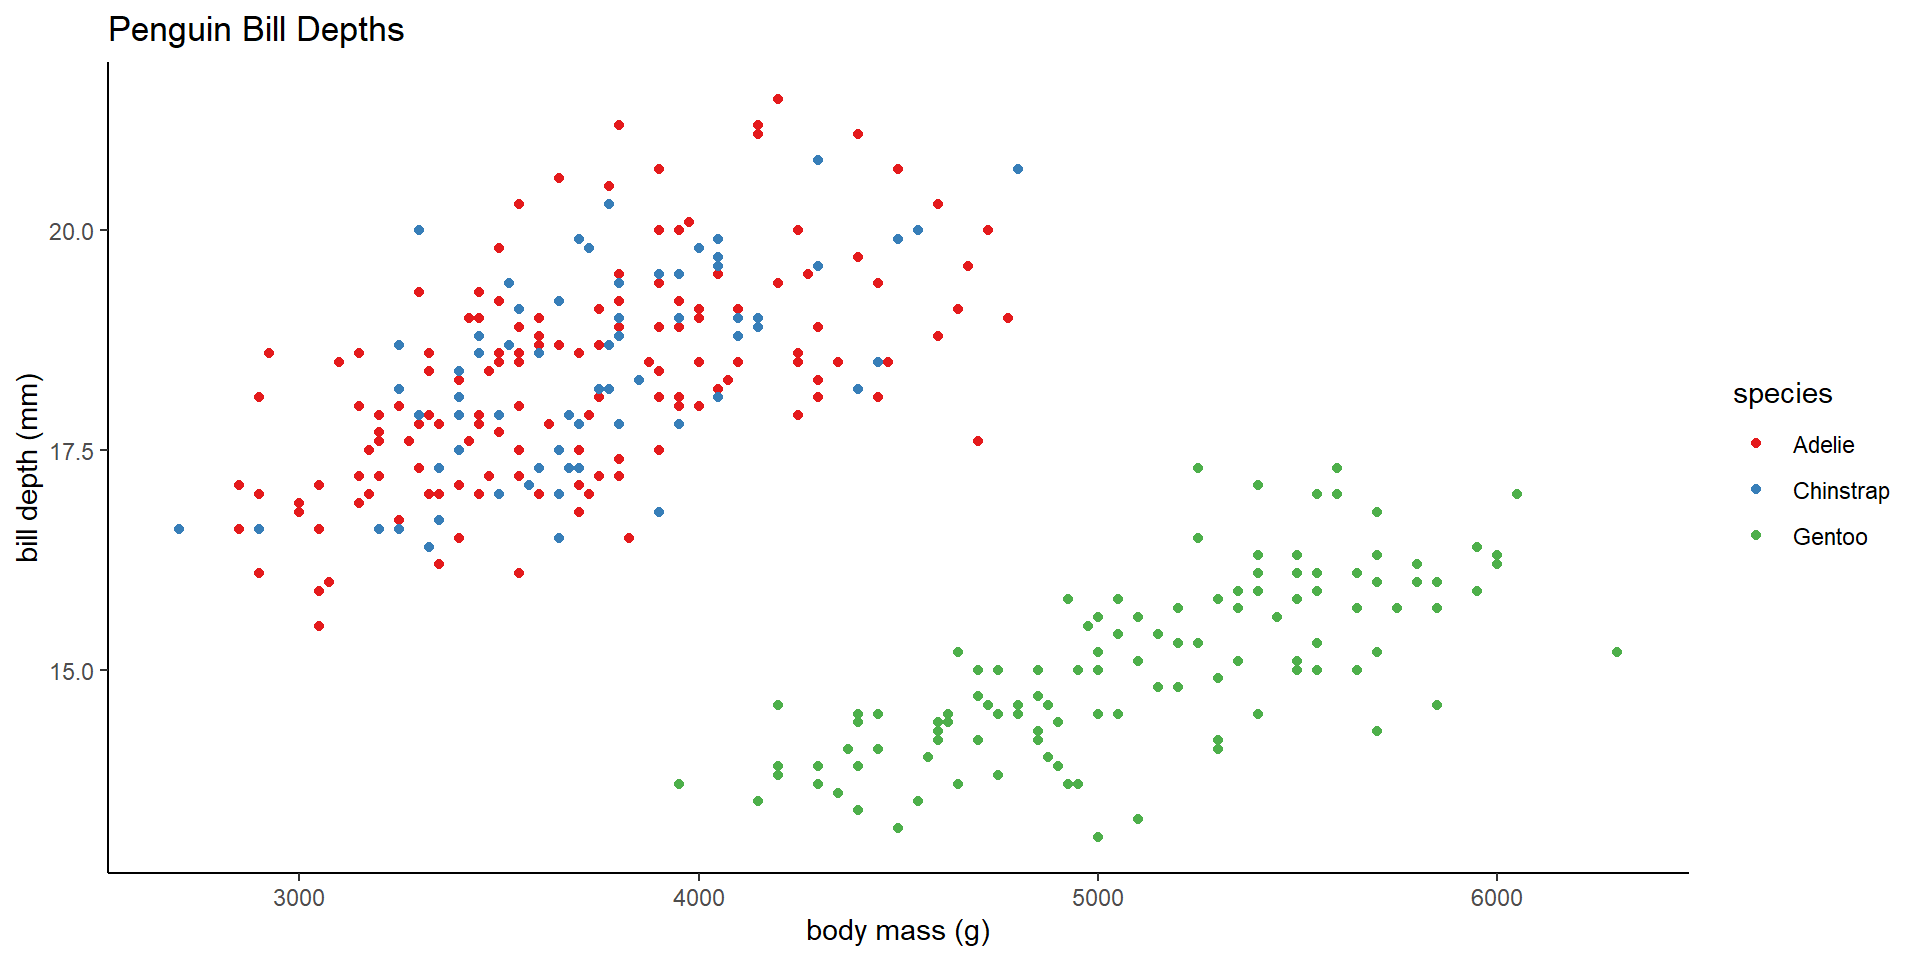
+ theme_classic ()
Using complete themes
Even more complete themes
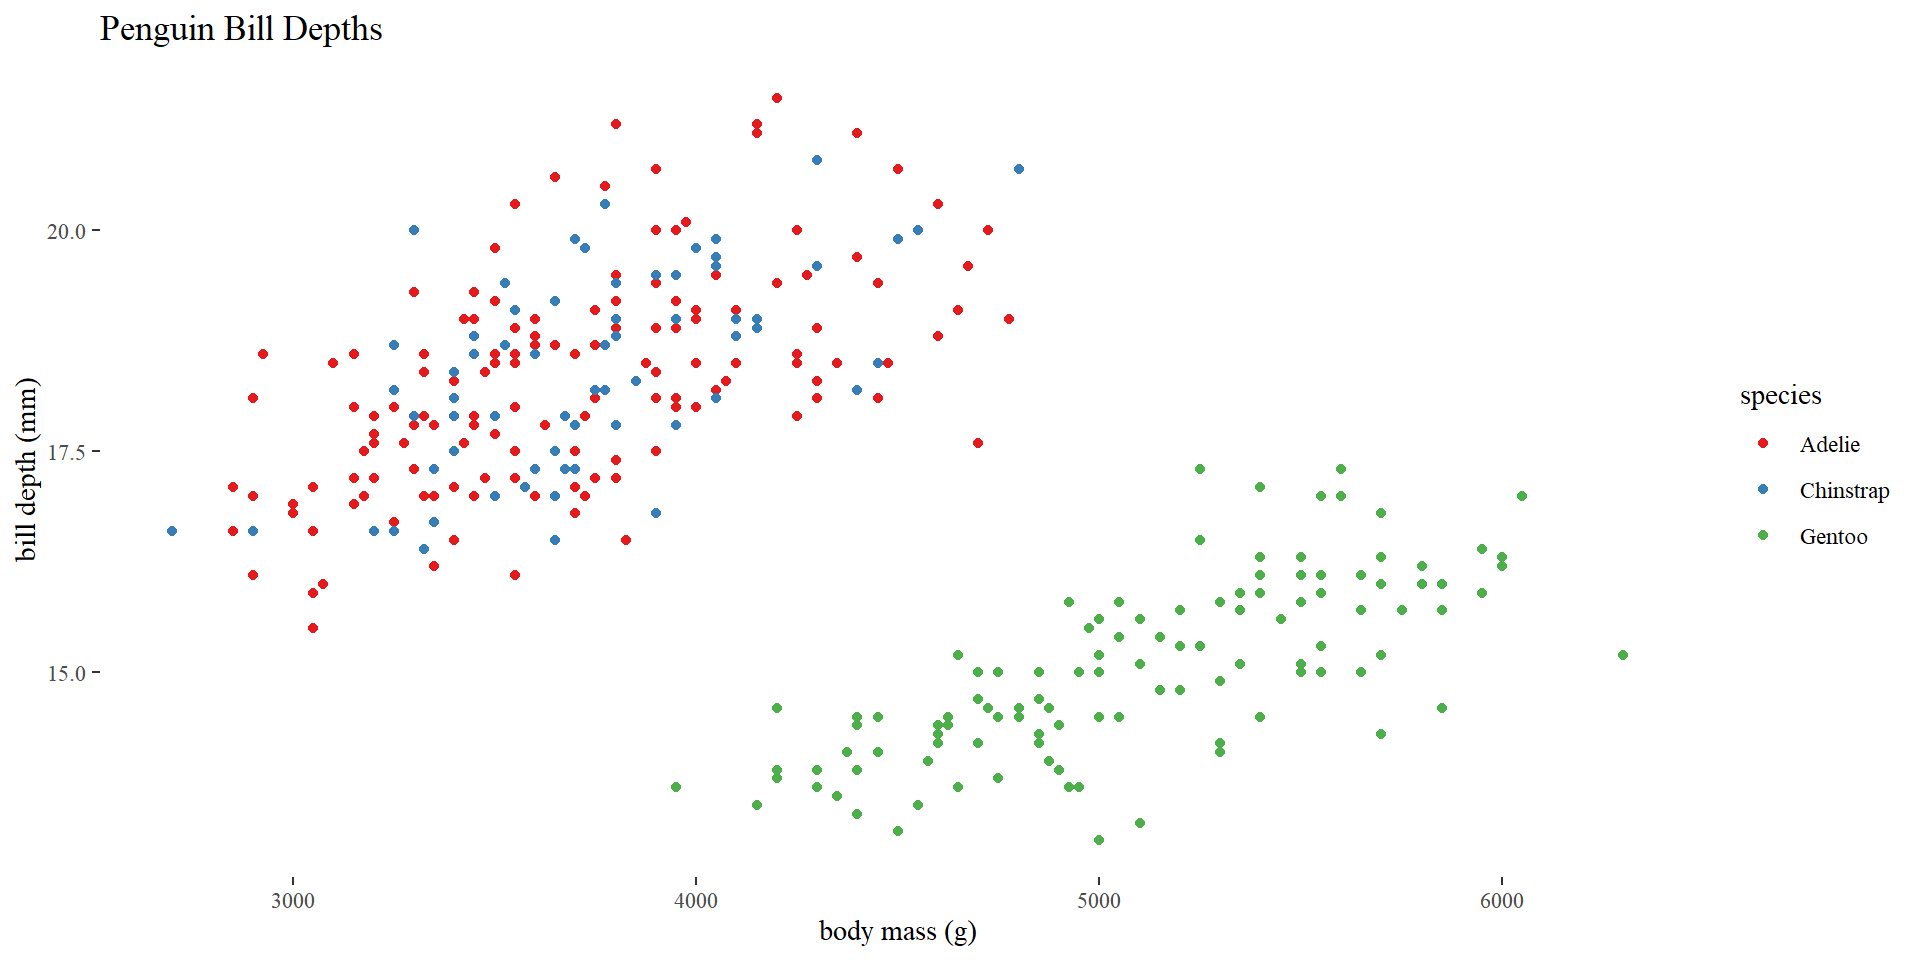
library (ggthemes)+ theme_tufte ()
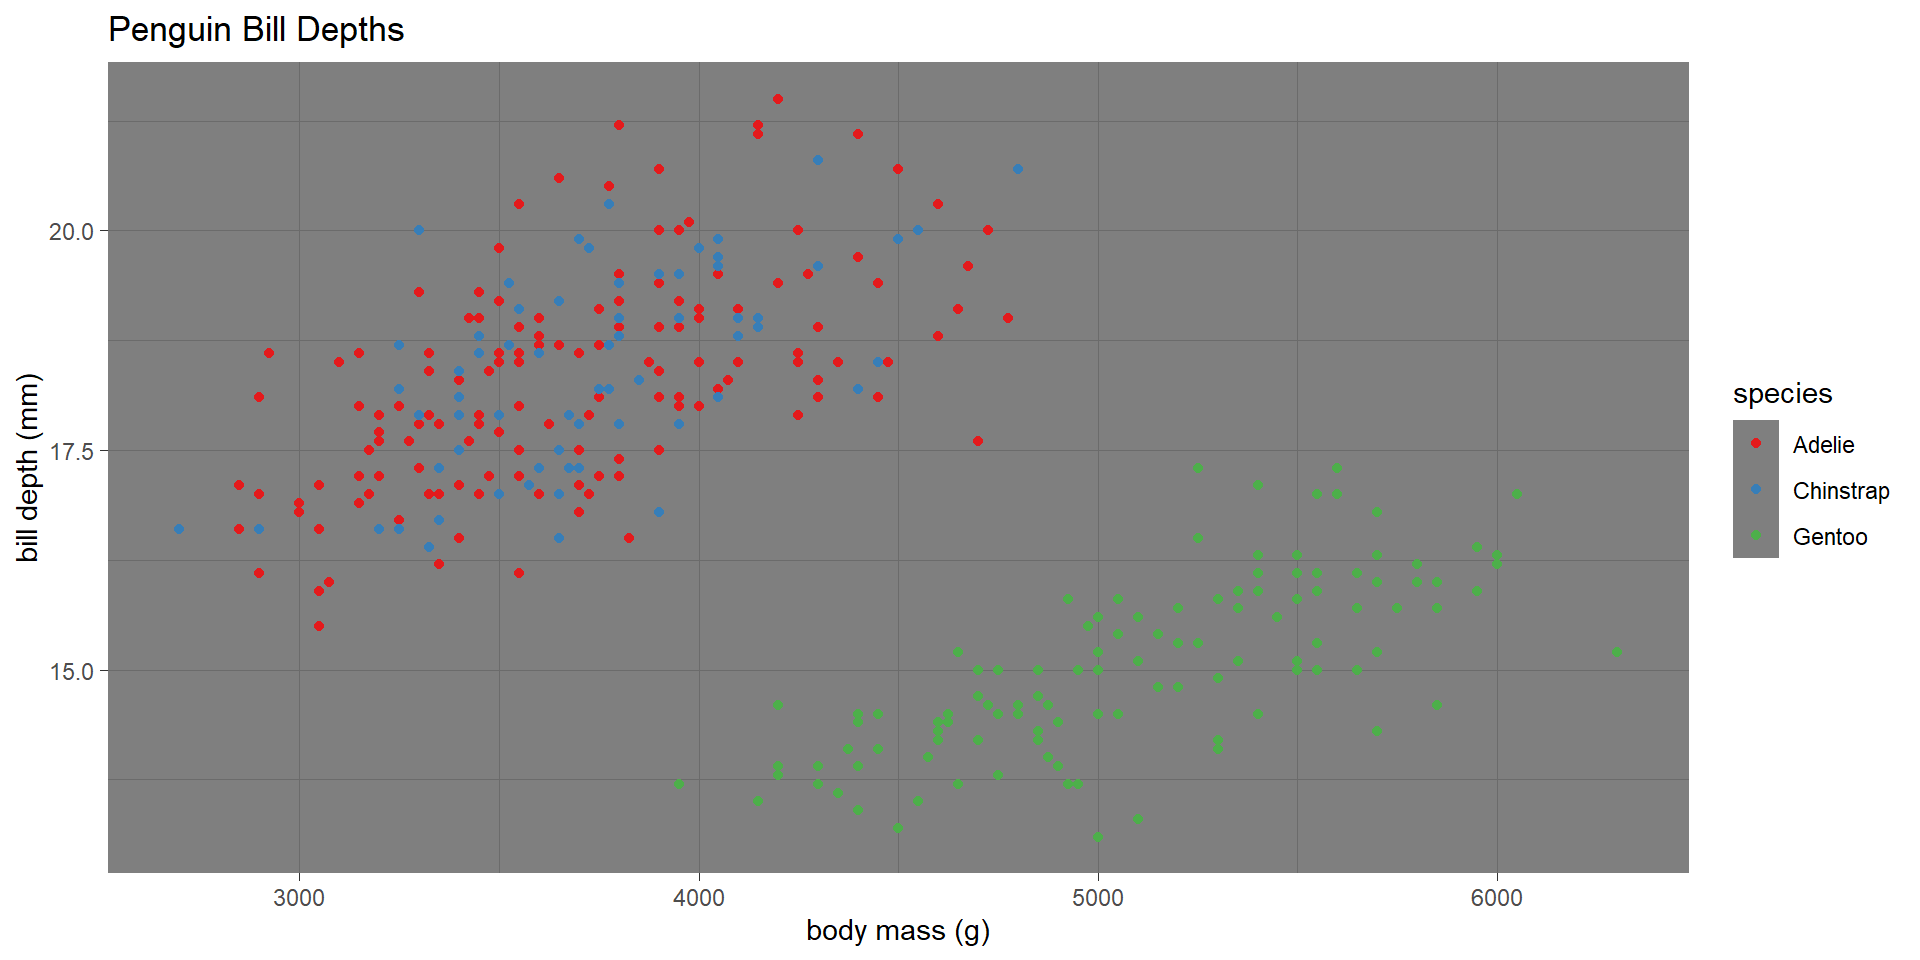
Even more complete themes
library (ggthemes)+ theme_excel ()
Customizing appearance with theme
Theme elements are the non-data parts of your plot (e.g., text, These can be accessed using the theme function:
basePlot + theme(element.name = element_function())
Where element.name refers to the element of the graph (e.g., axis.ticks for the tick marks), and the element_function controls what aspect of it is going to be changed (e.g., line width).
Customizing appearance with theme
element_text() controls text face, color, size, angle, etc.
element_line() controls line color, linewidth, and linetype
element_rect() controls rectangular areas fill and border line
element_blank() controls whether an element is drawn or not
Note: this will remove a drawing rather than make it invisible!
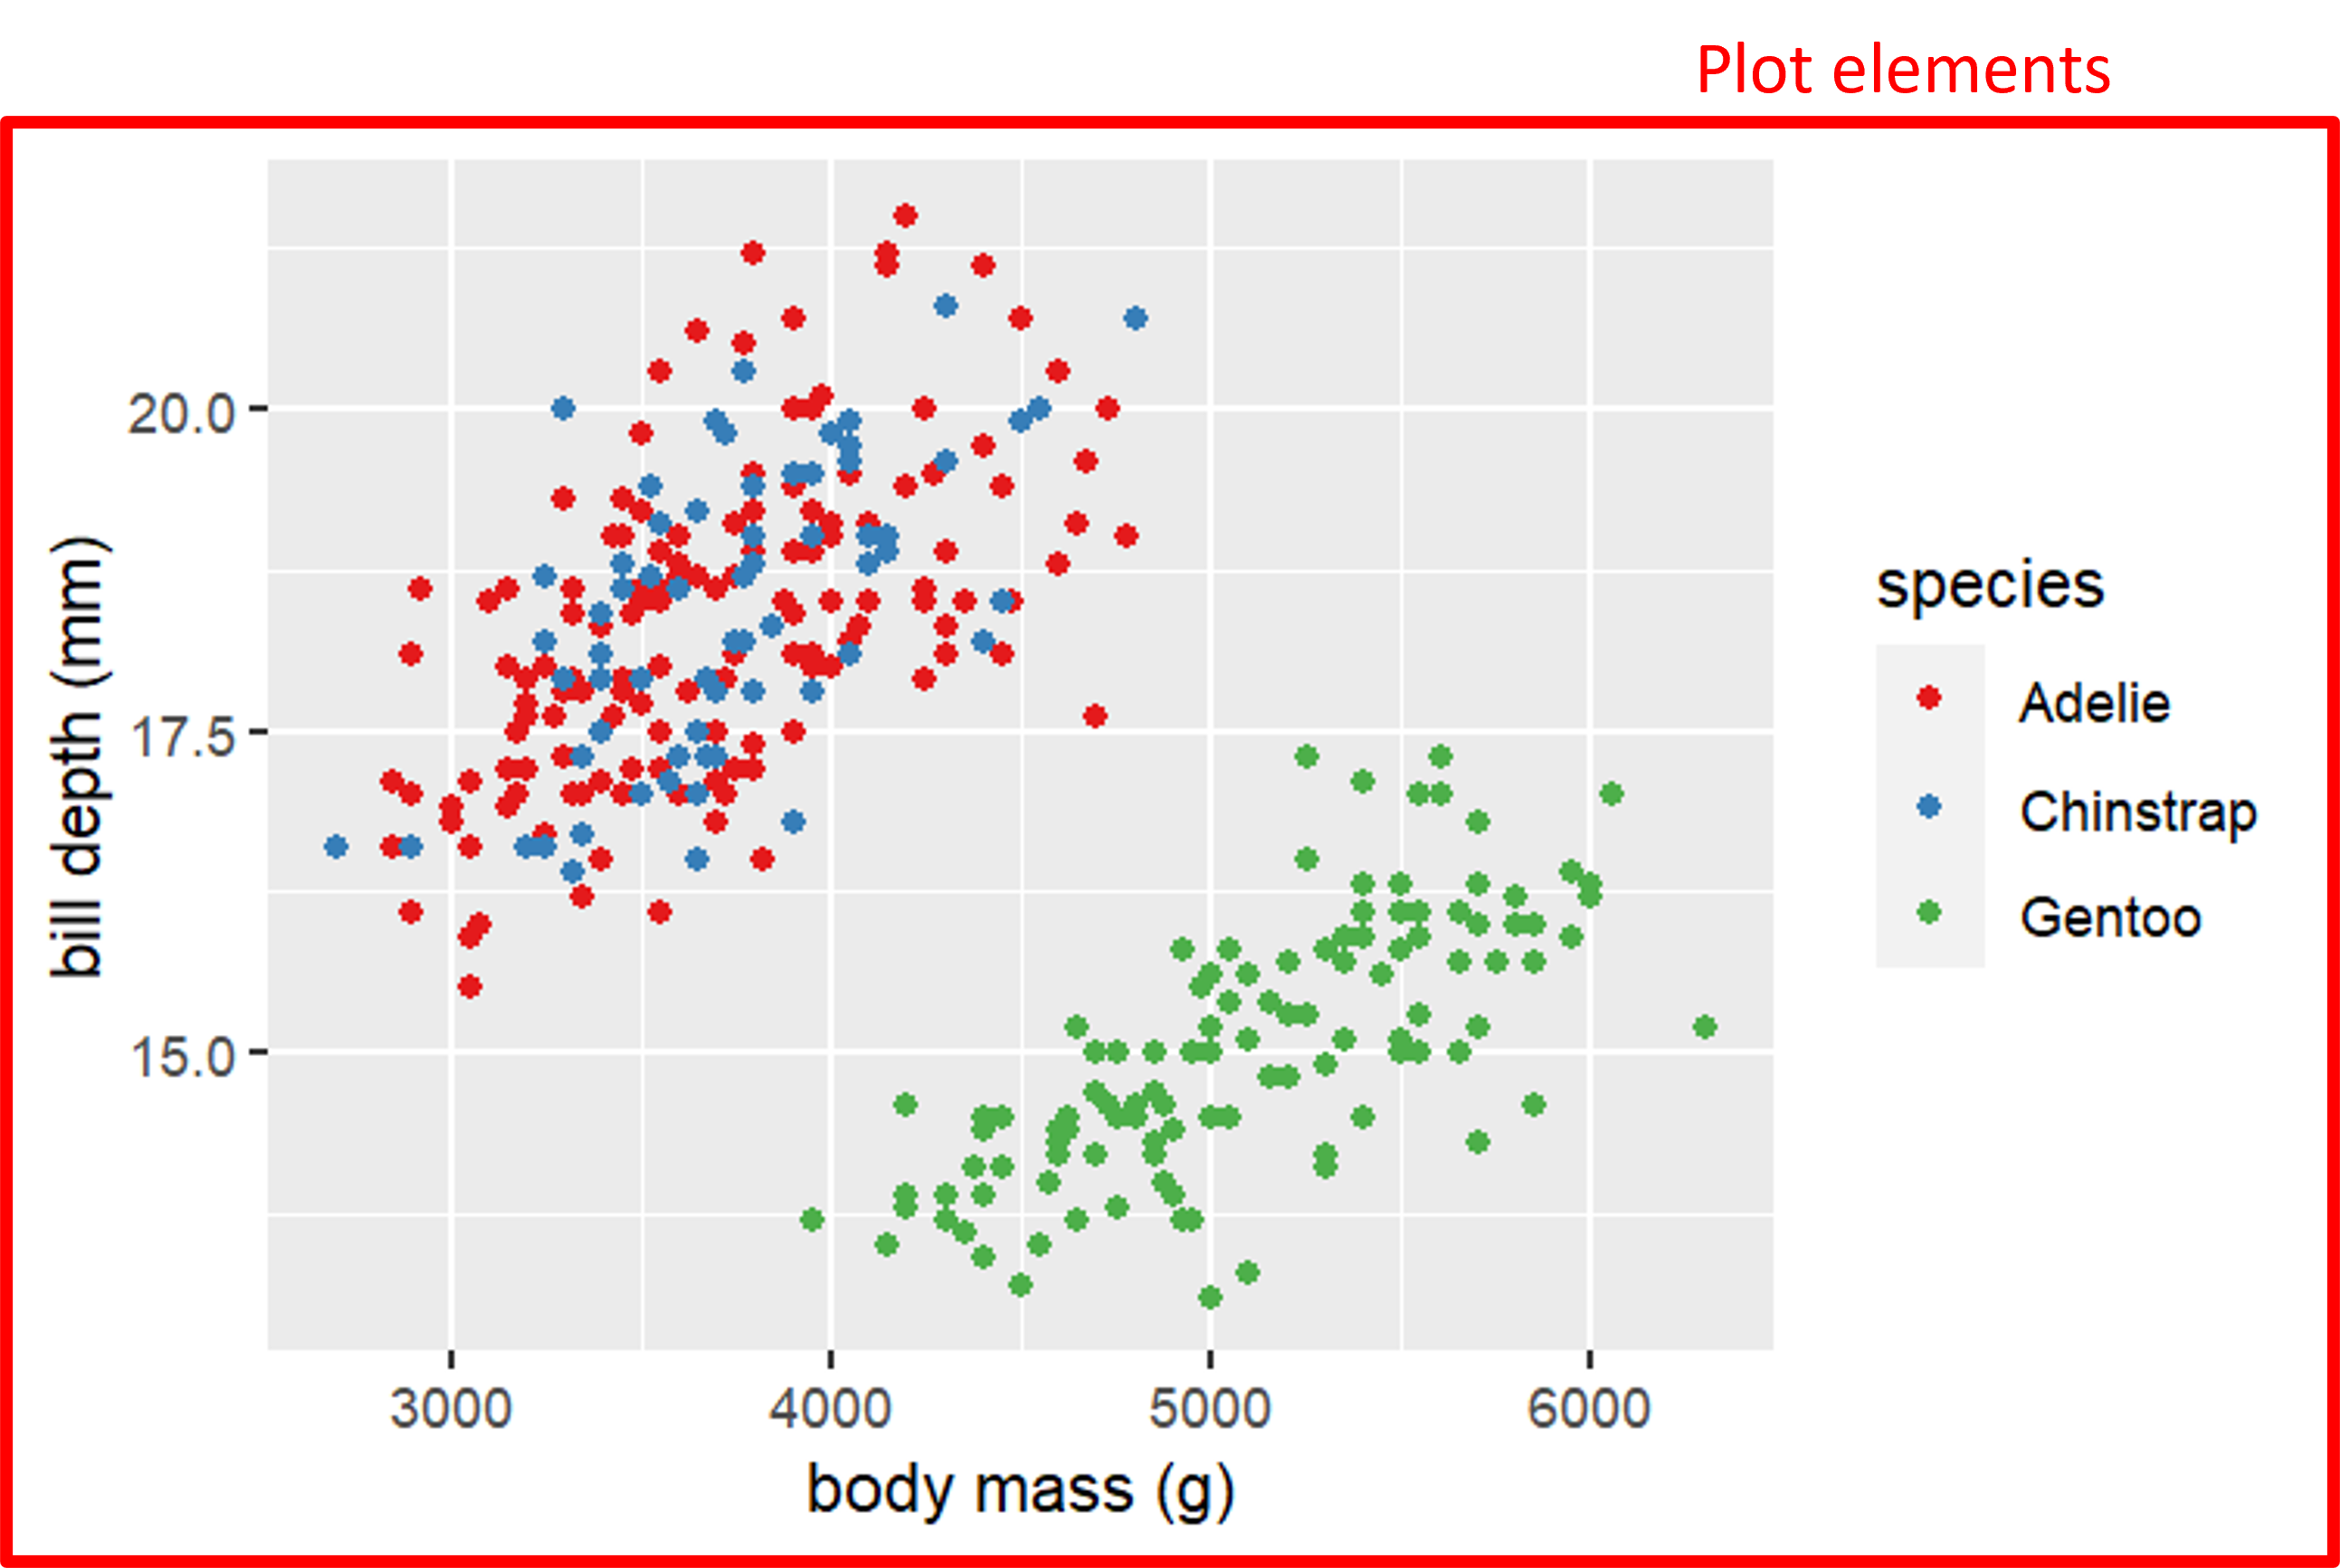
Customizing plot elements
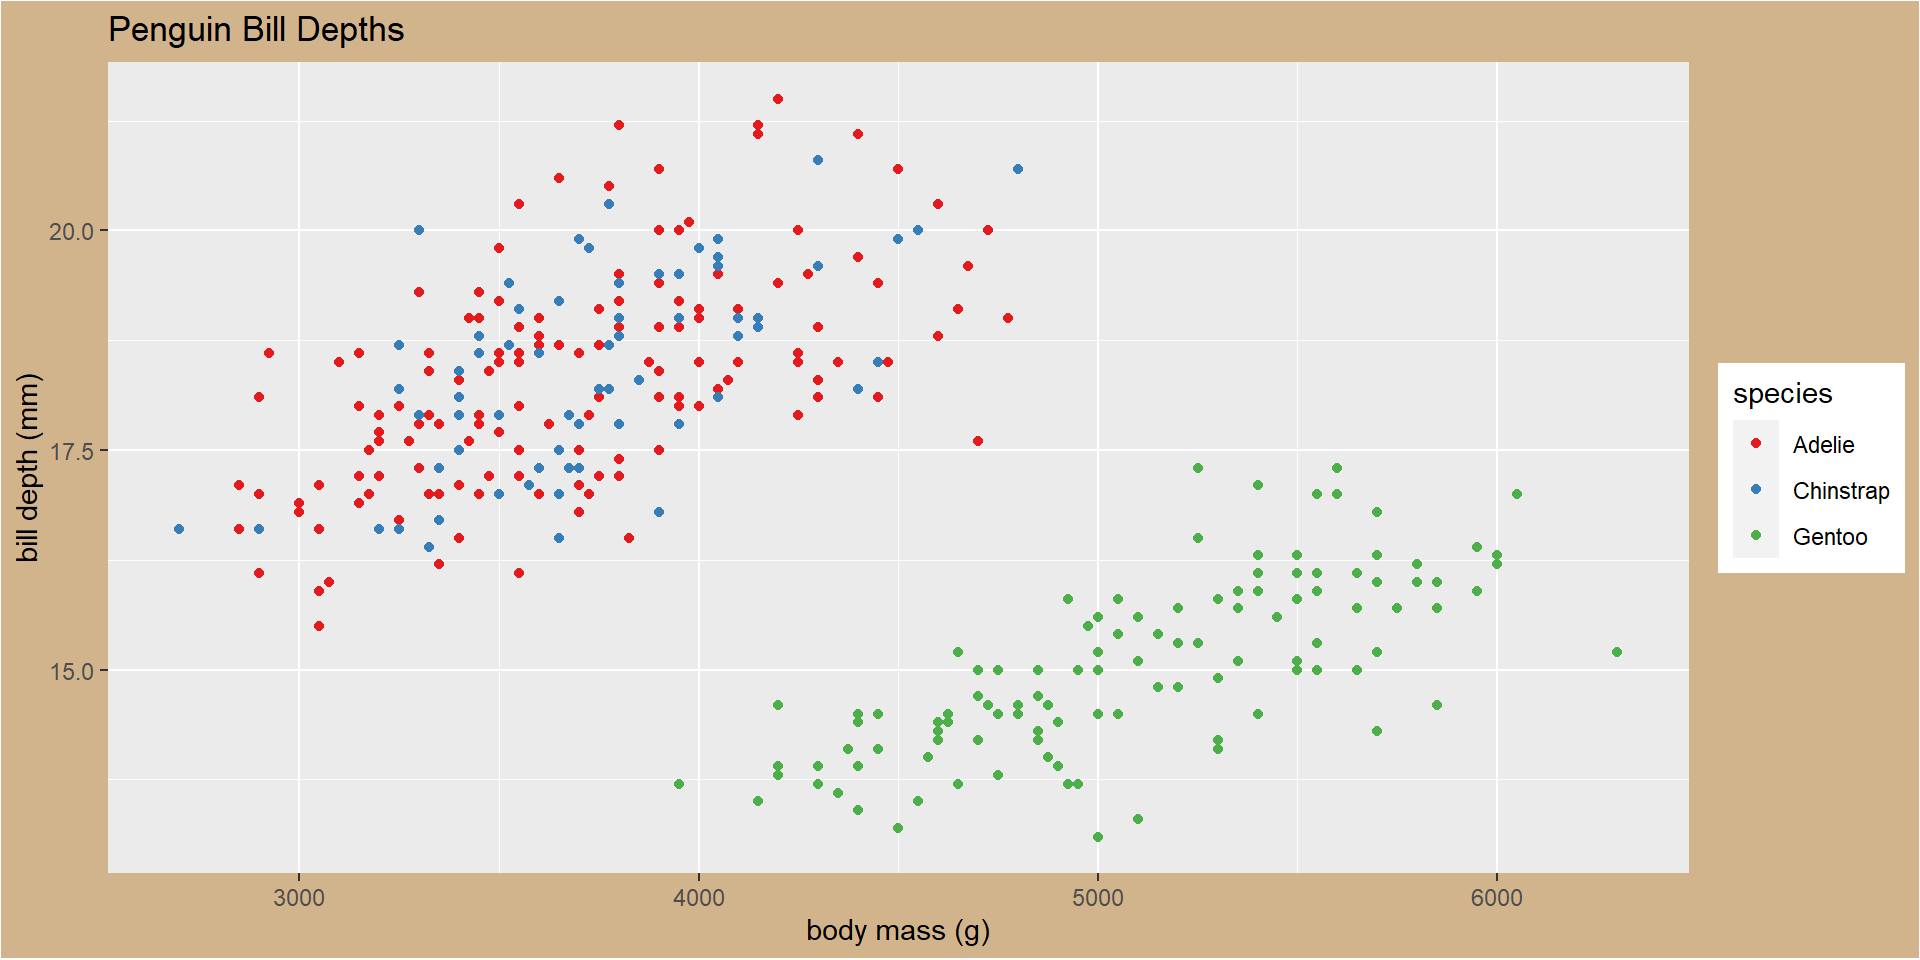
Customizing plot elements
+ theme (plot.background = element_rect (fill = "tan" )
Customizing plot elements
Try customizing your graph using the following (use ? to get function help).
plot.background
element_rect
Plot background area
plot.title
element_text
Plot title
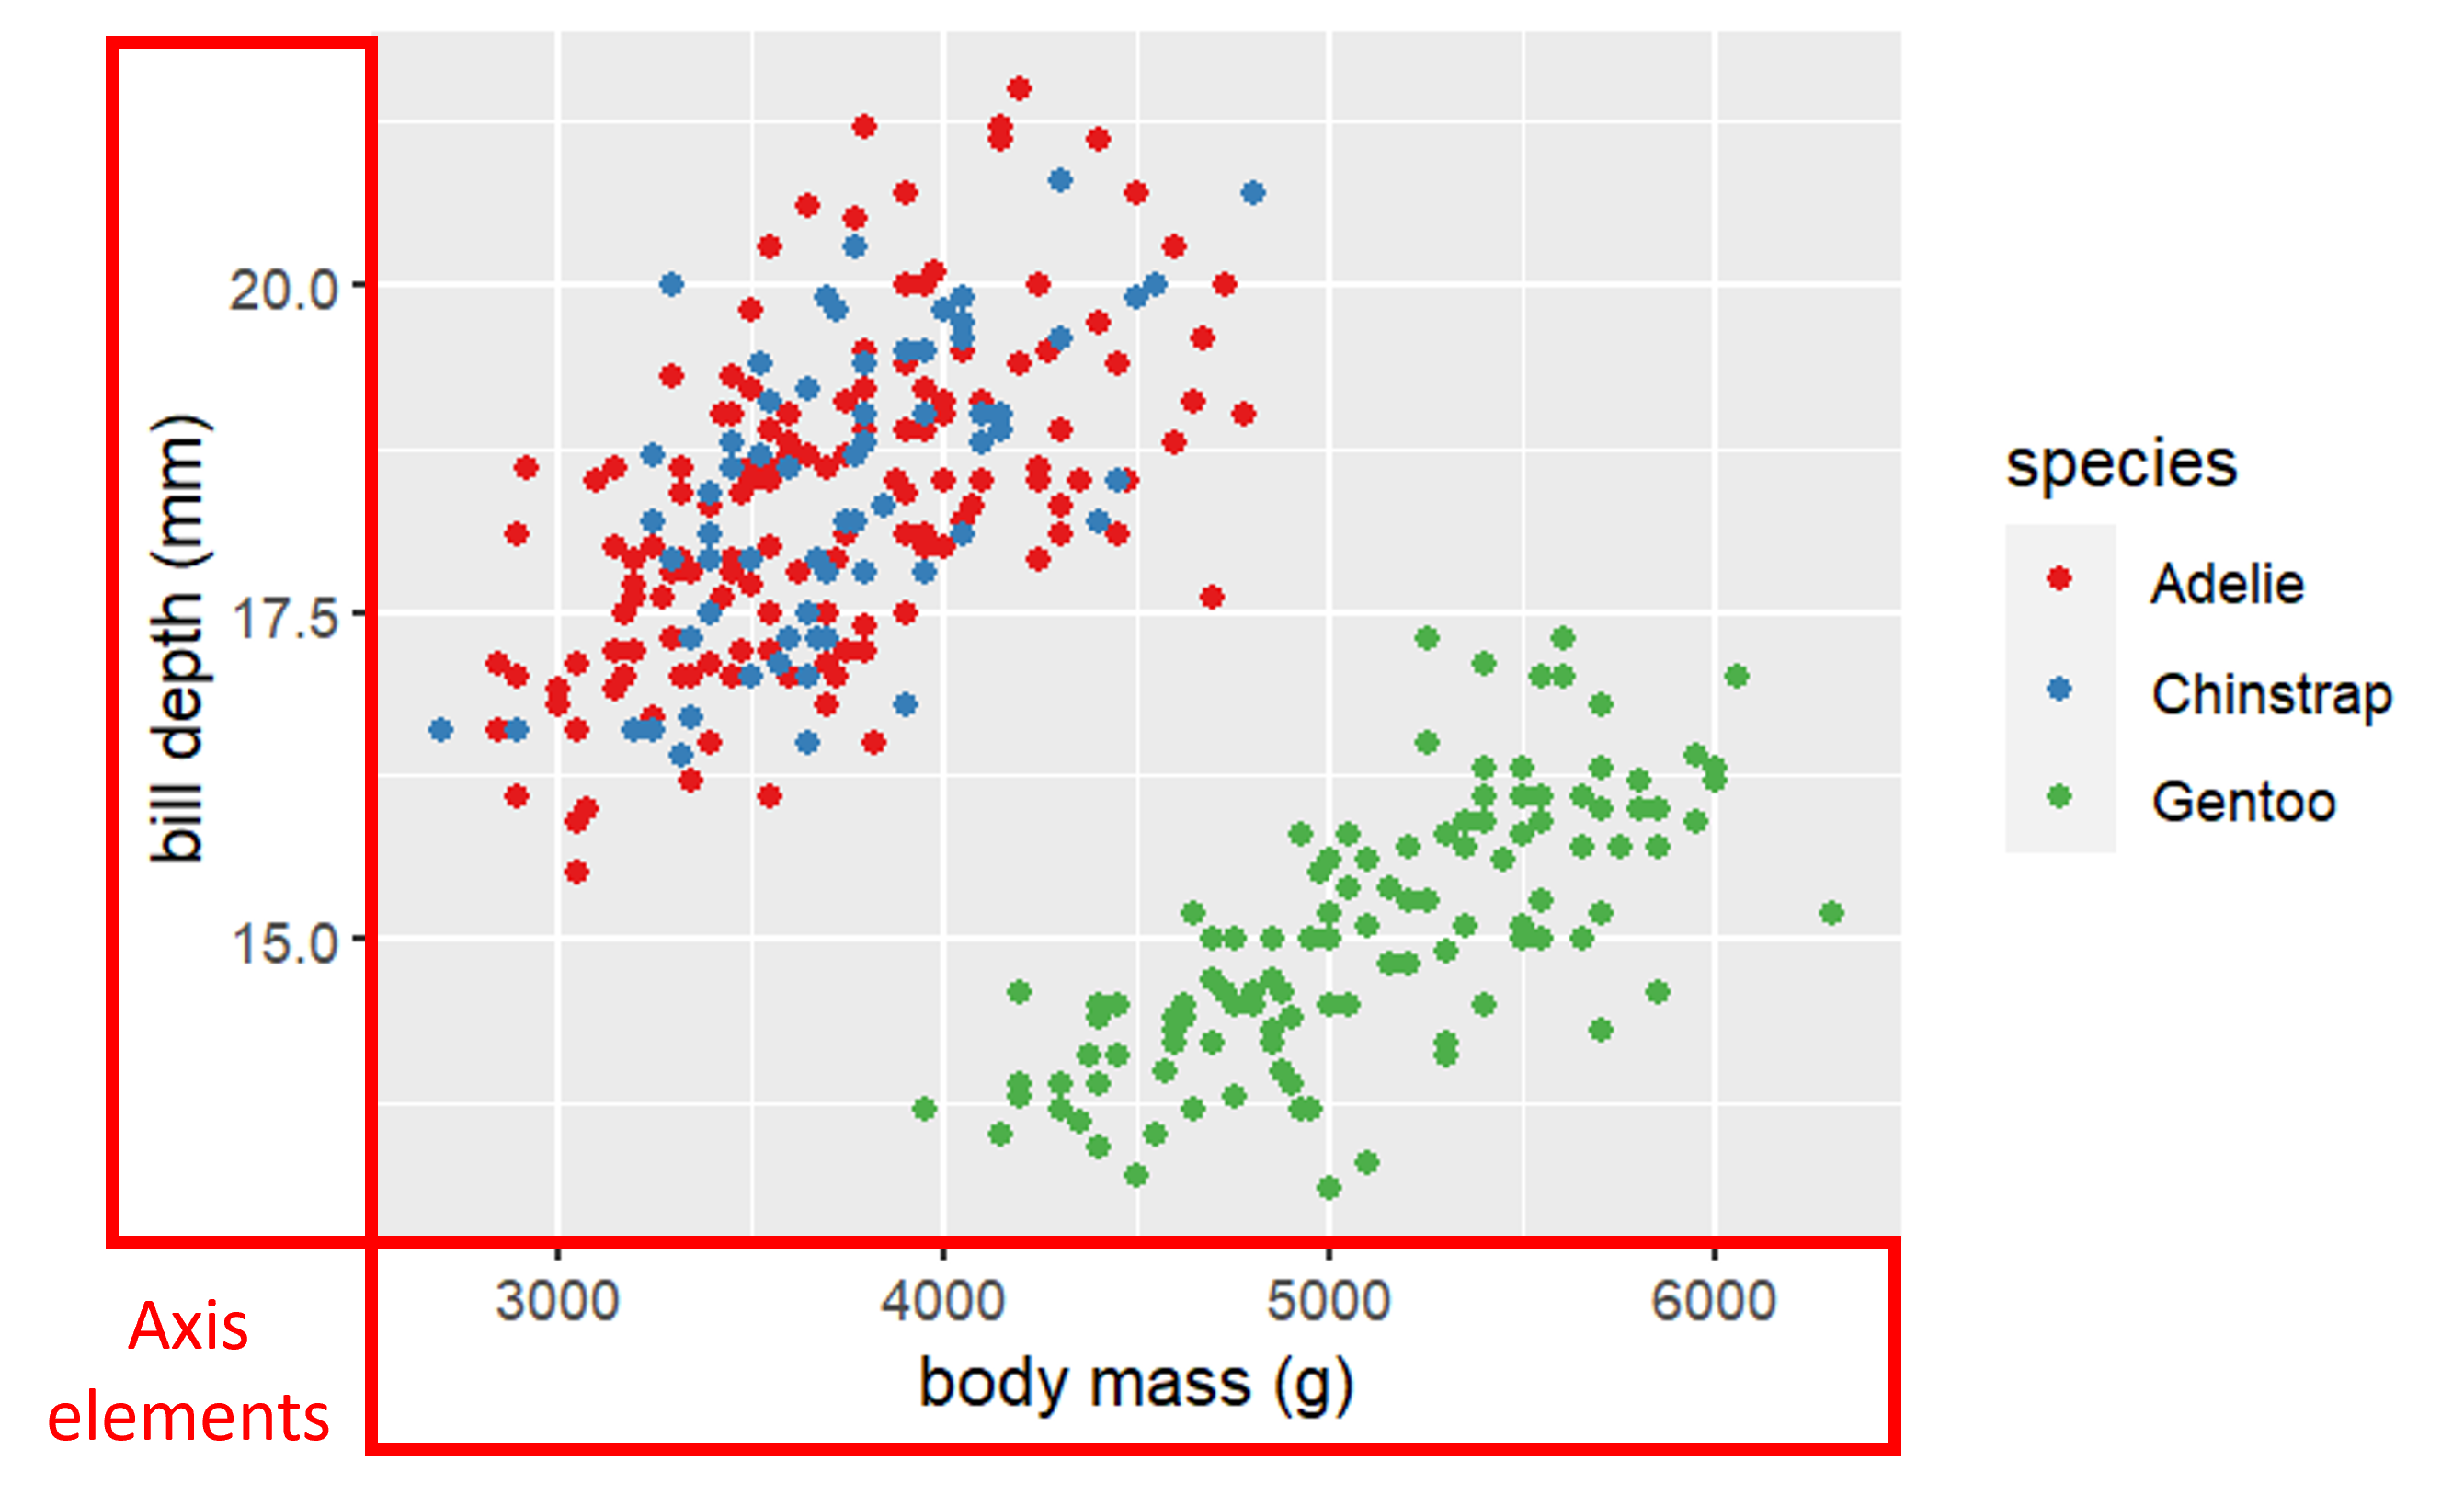
Customizing axis elements
Customizing axis elements
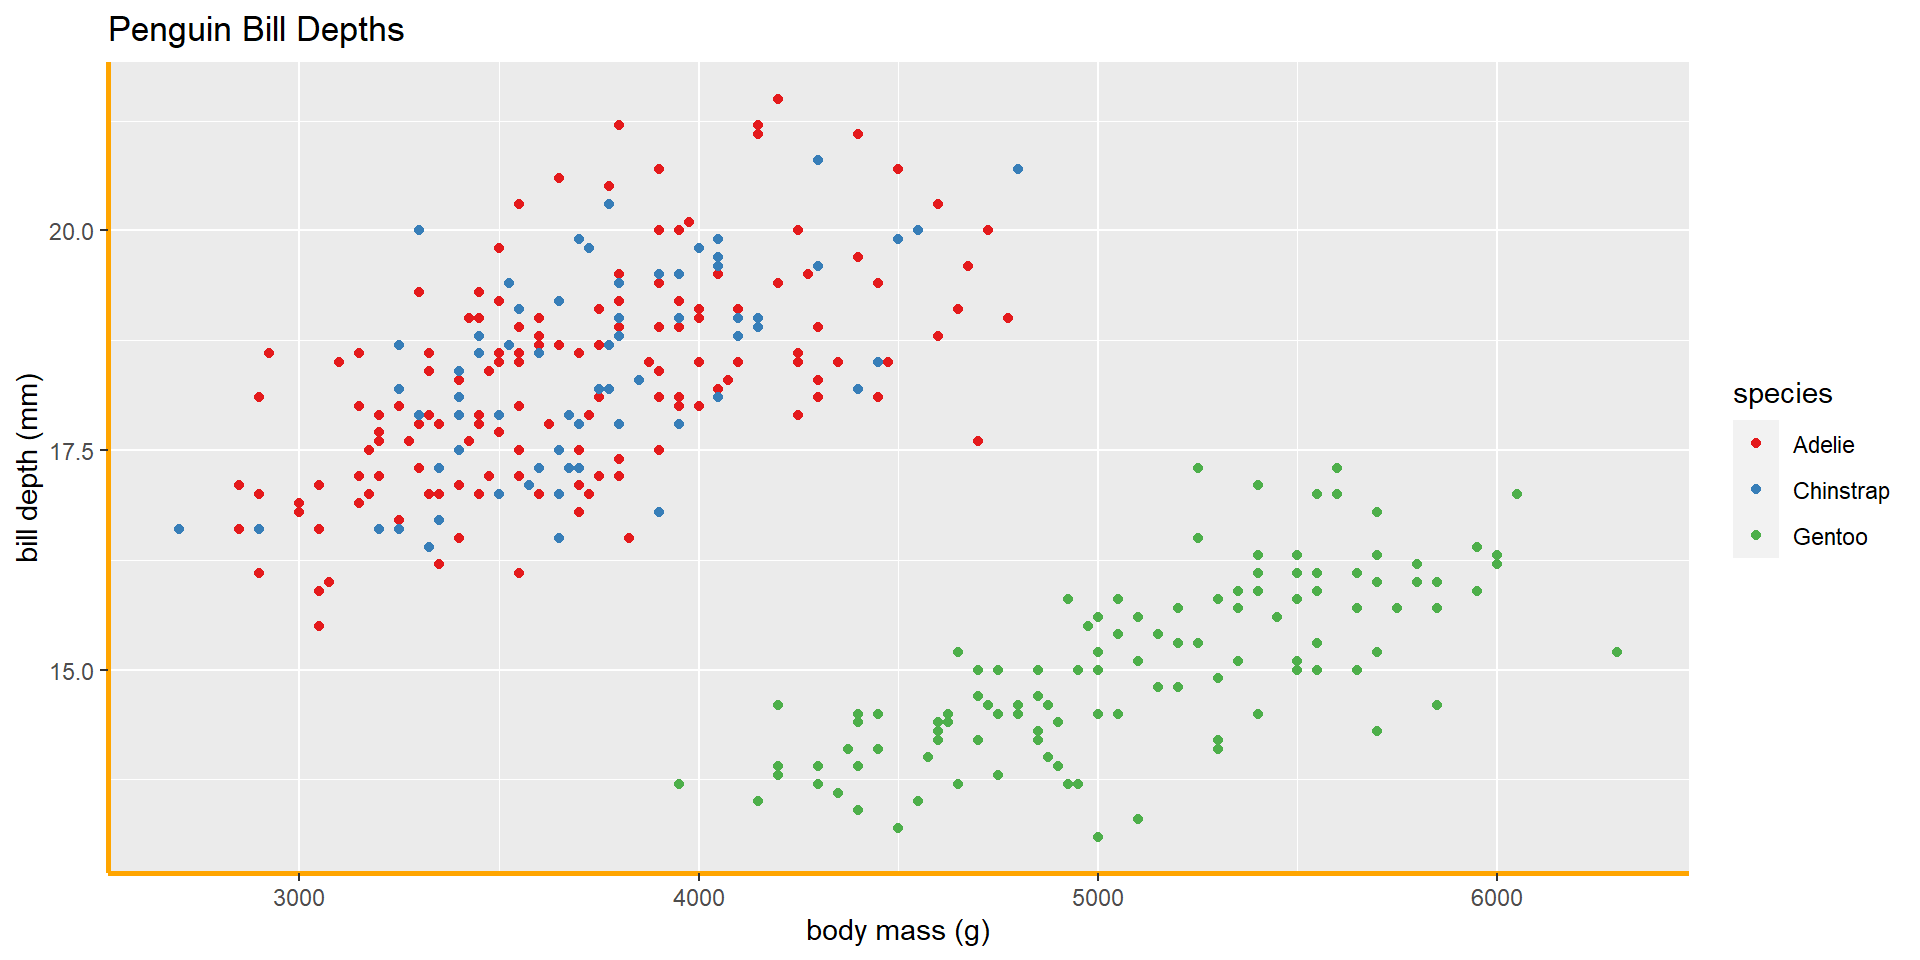
+ theme (axis.line = element_line (colour = "orange" , linewidth = 1 )
Customizing axis elements
You can modify just one axis by adding .x or .y to your element name.
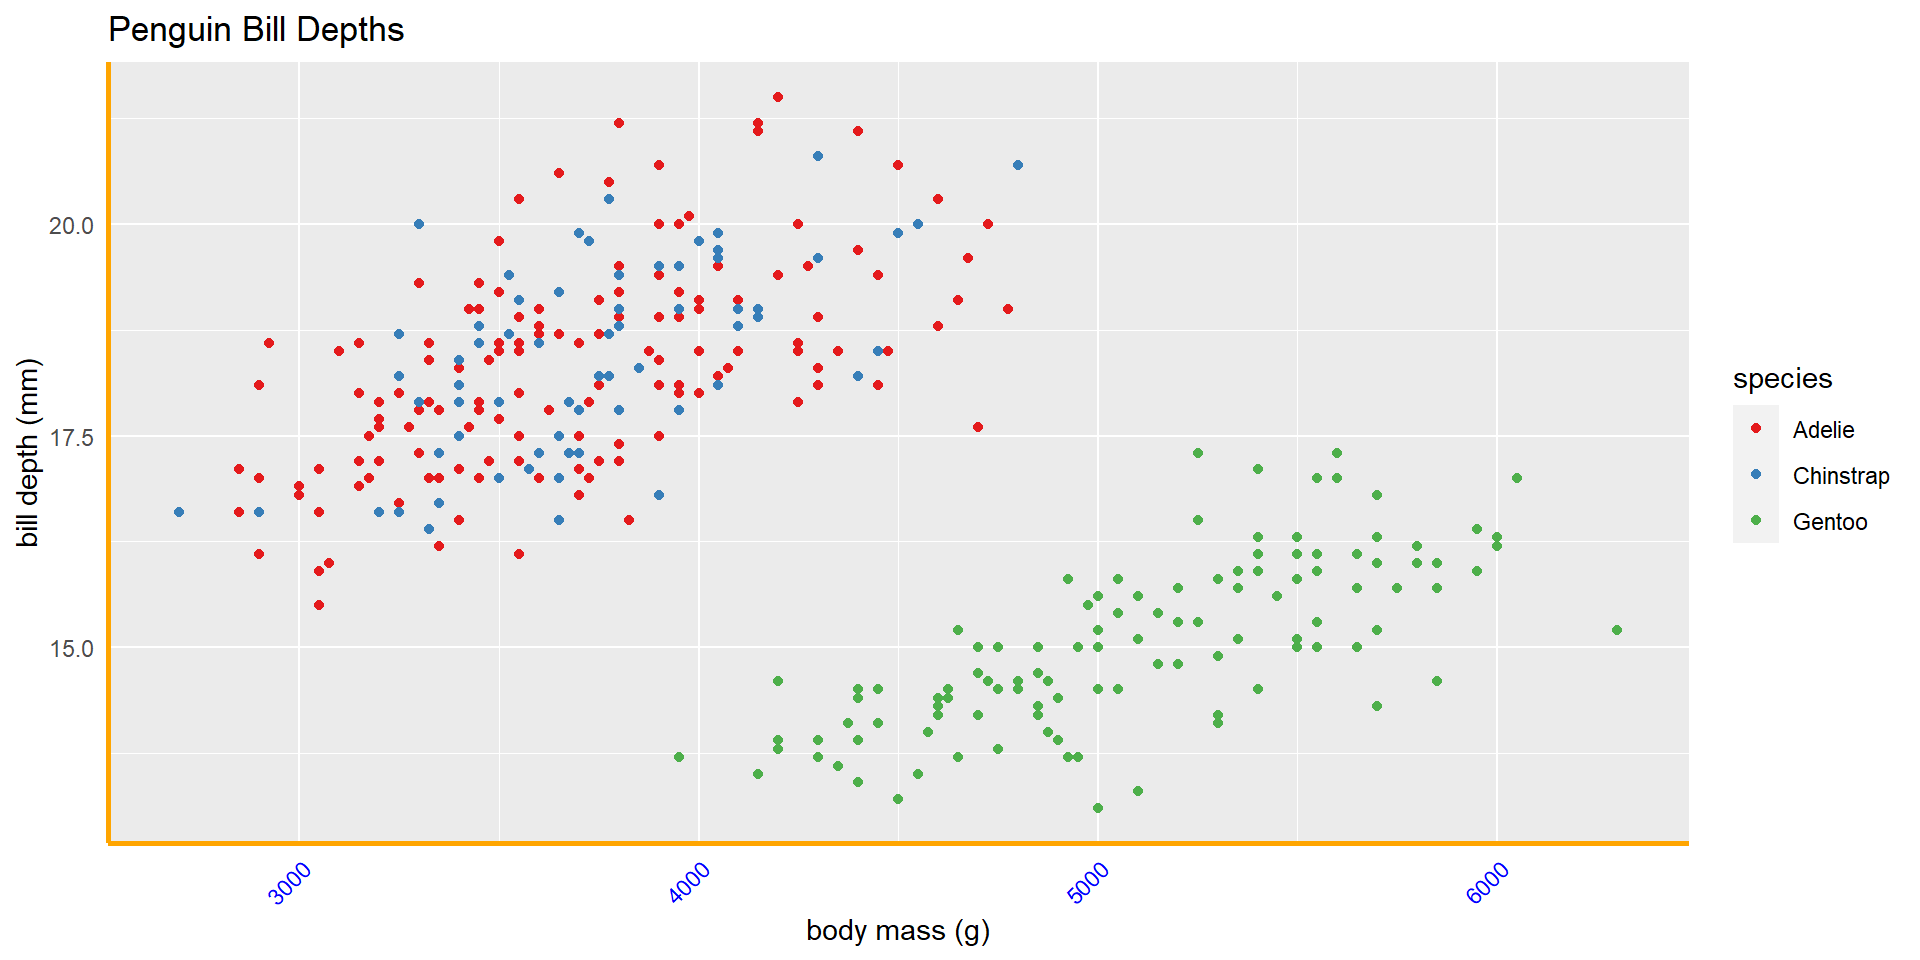
+ theme (axis.line = element_line (colour = "orange" , linewidth = 1 ),axis.text.x = element_text (angle = 45 ,vjust= 1 ,hjust = 1 ,color= "blue" )
Customizing axis elements
You can remove an element by using element_blank()
+ theme (axis.line = element_line (colour = "orange" , linewidth = 1 ),axis.text.x = element_text (angle = 45 ,vjust= 1 ,hjust = 1 ,color= "blue" ),axis.ticks = element_blank ()
Customizing axes
Try customizing your graph using the following (use ? to get function help).
axis.line
element_line()
Axis line
axis.text
element_text()
Text at tick marks
axis.title
element_text()
Axis title
axis.ticks
element_line()
Tick marks
axis.ticks.length
unit()
Length of tick marks
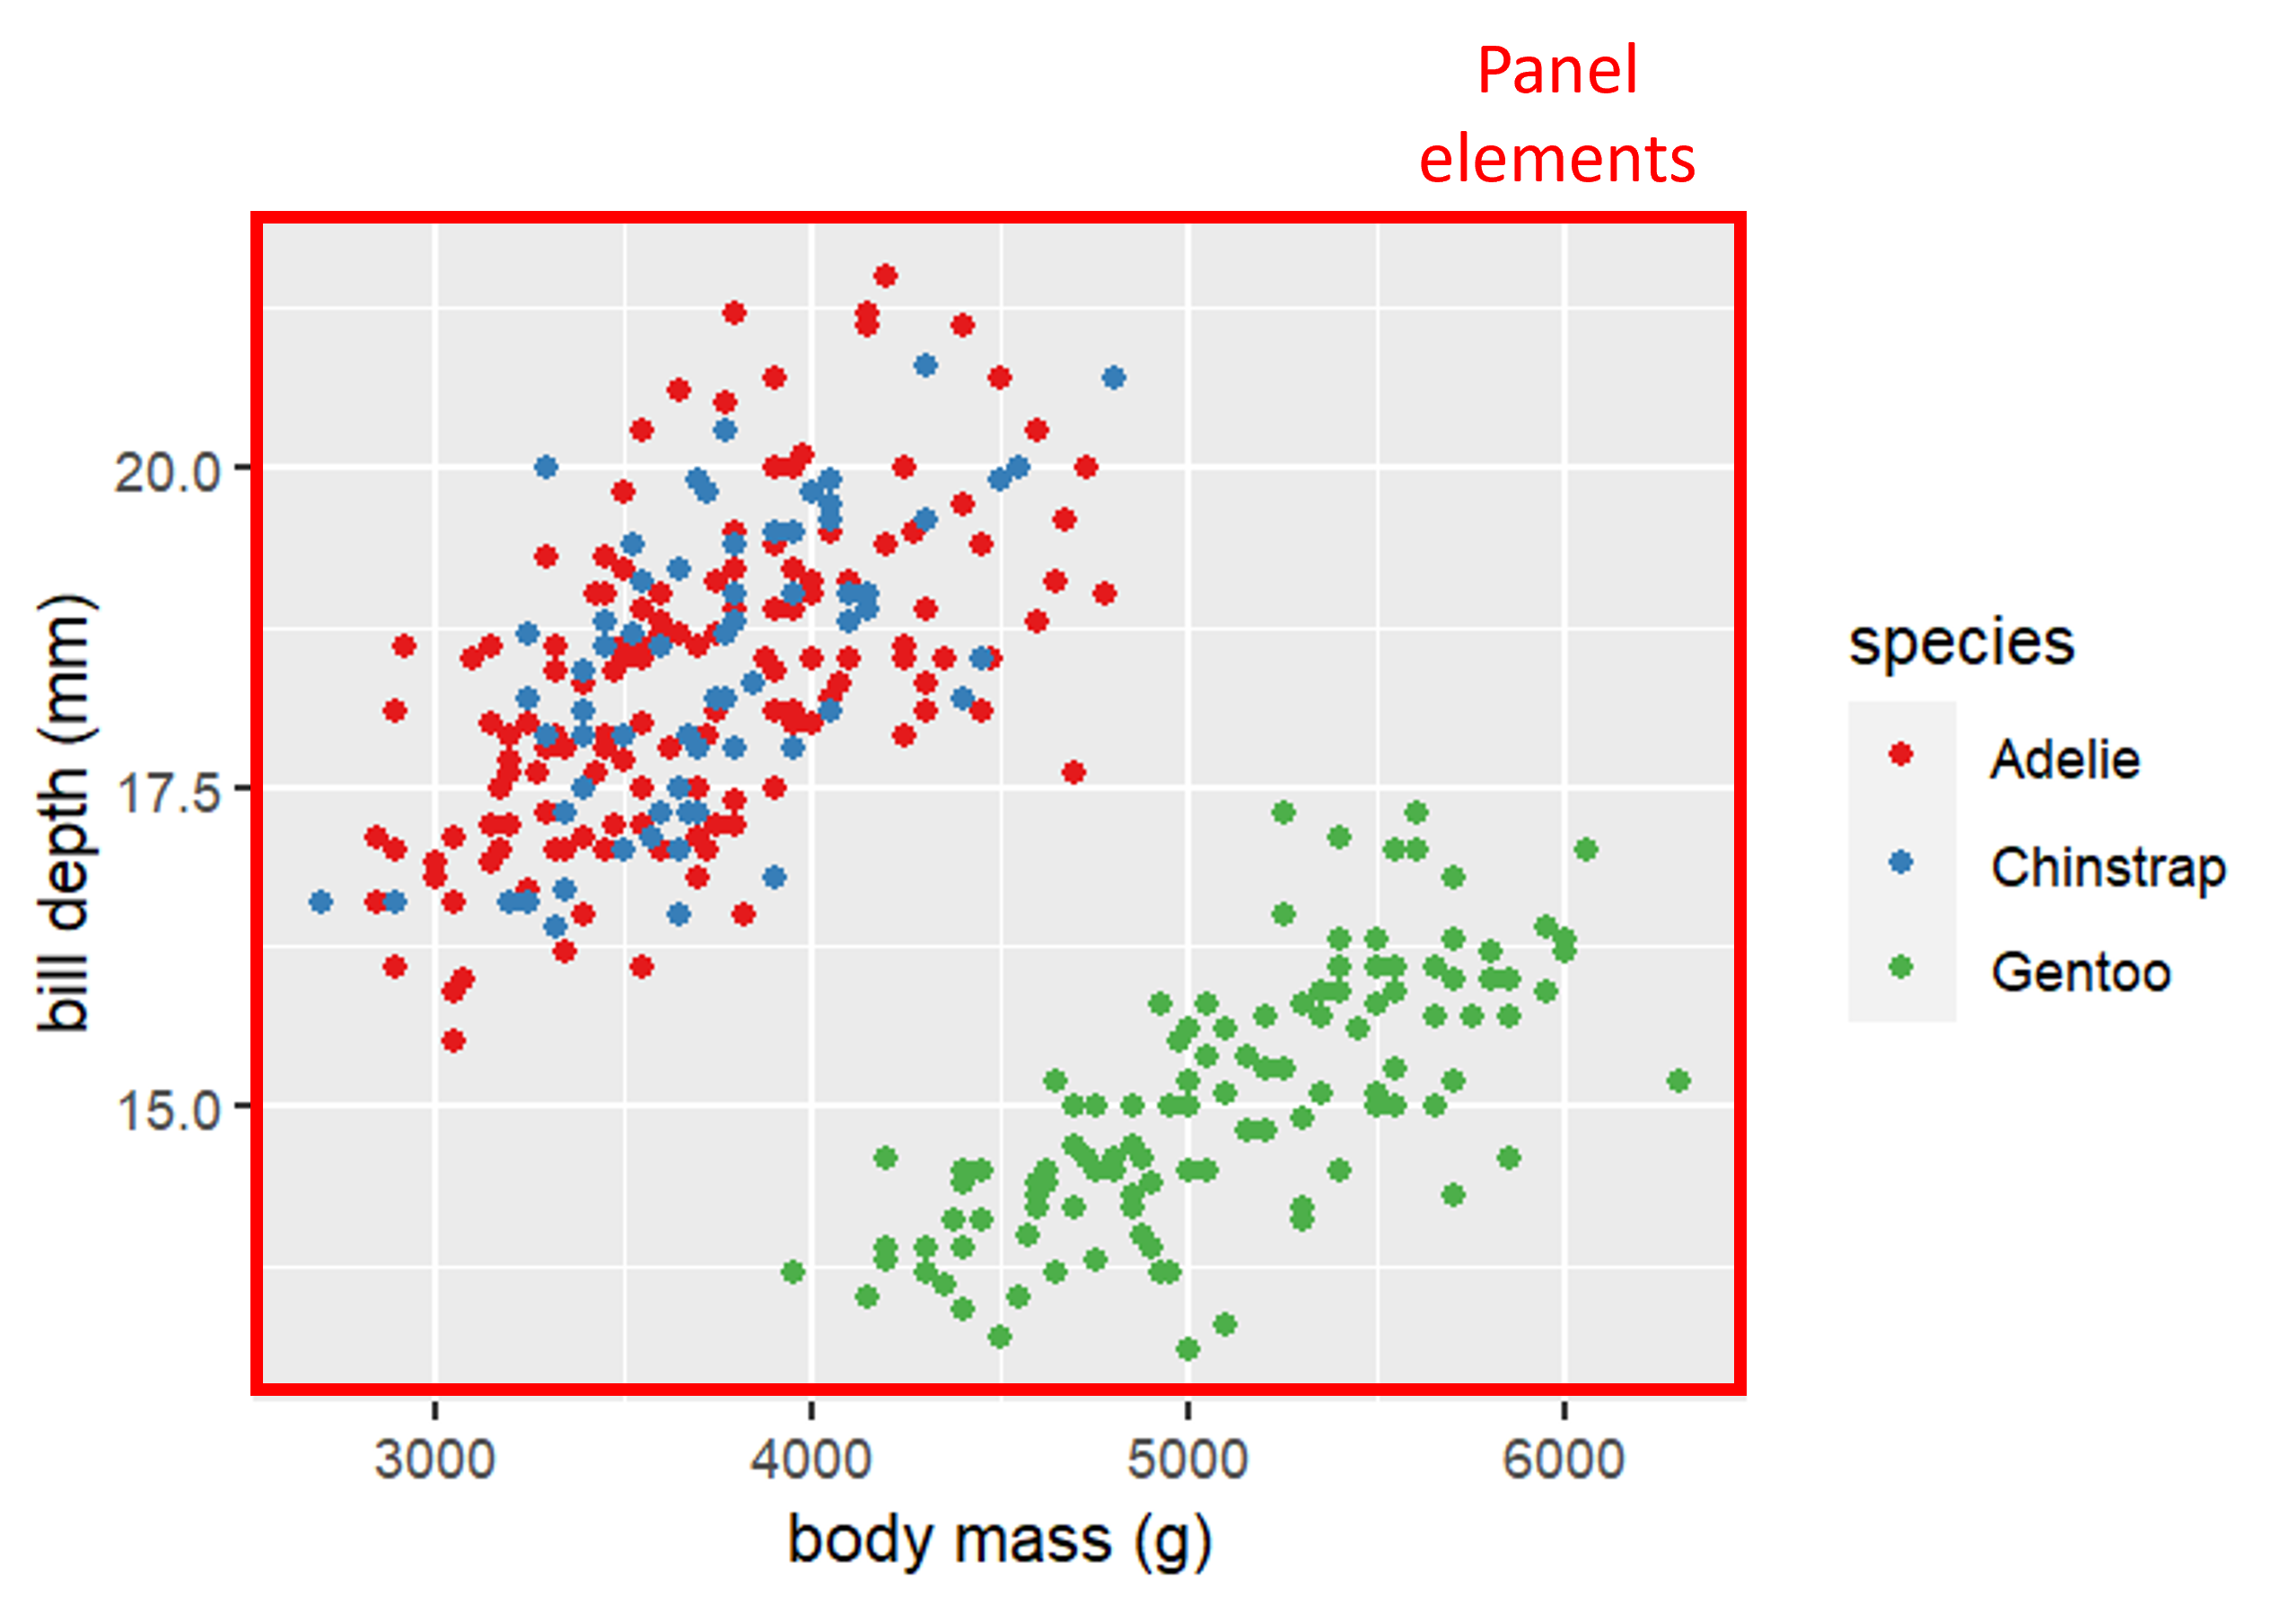
Customizing panel elements
Customizing panel elements
Try customizing your graph using the following (use ? to get function help).
panel.background
element_rect()
Panel background
panel.grid.major
element_line()
Major gridlines
panel.grid.minor
element_line()
Minor gridlines
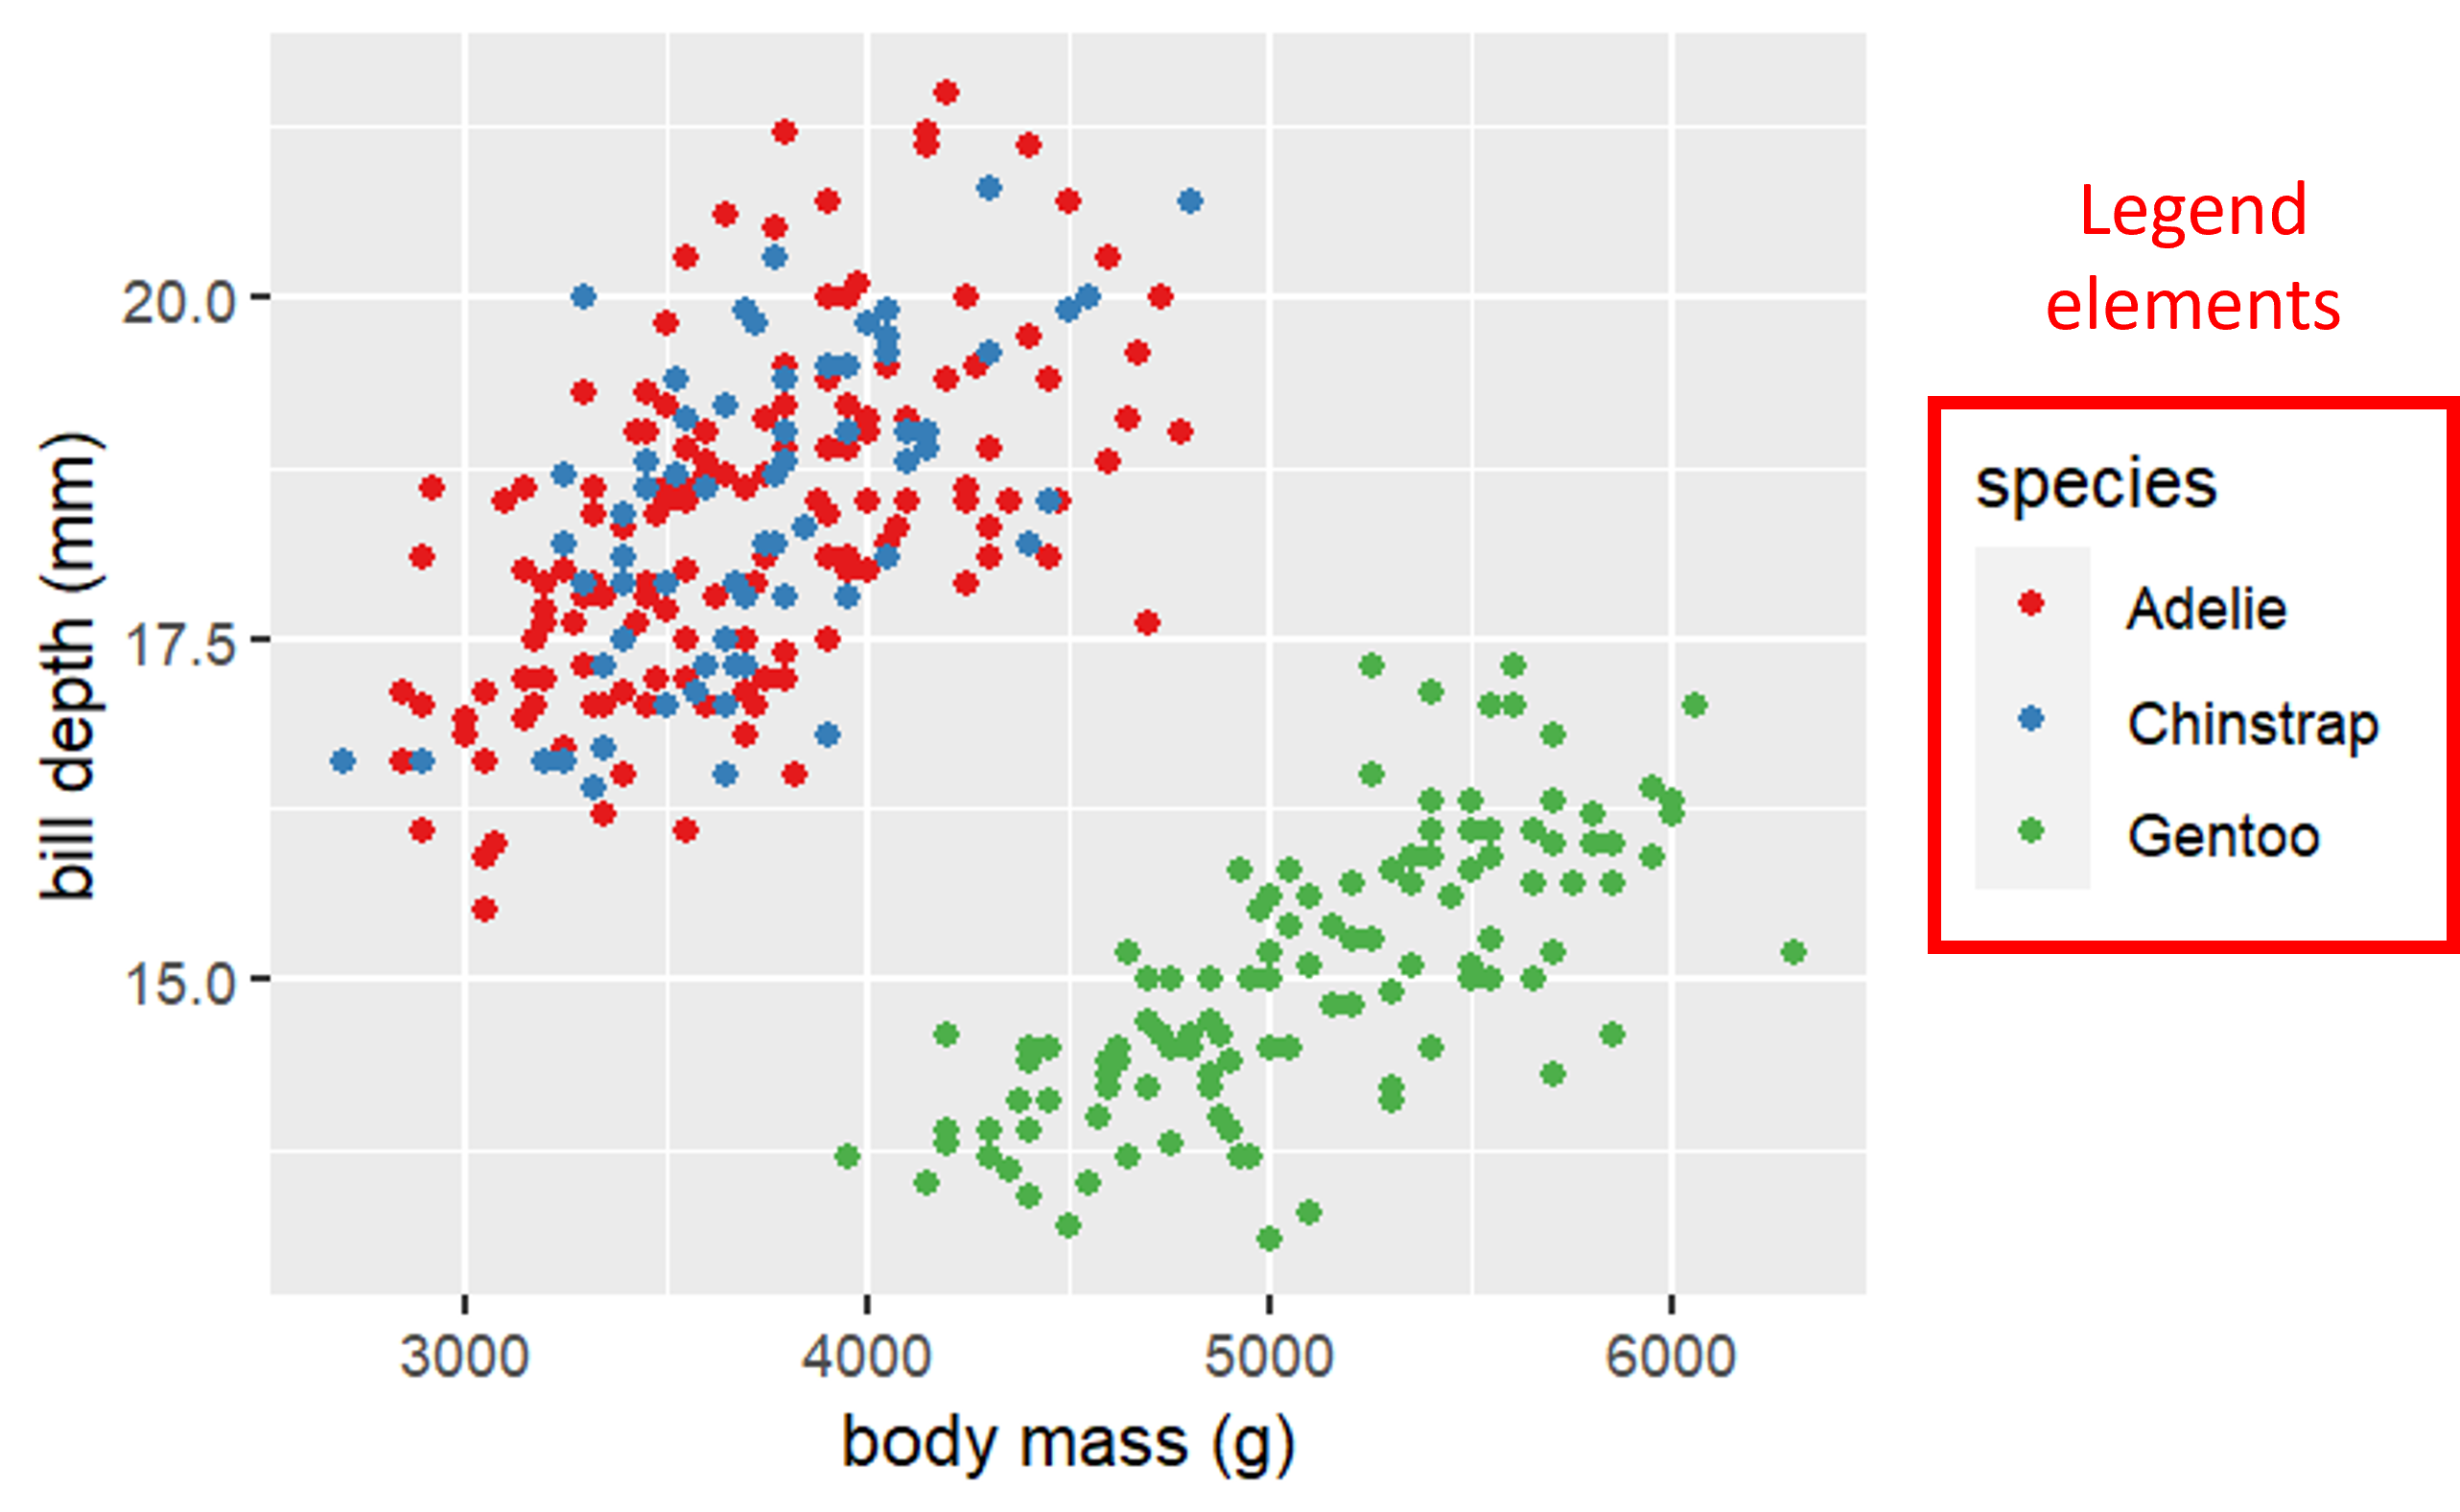
Customizing legend elements
Customizing legend elements
Try customizing your graph using the following (use ? to get function help).
legend.background
element_rect()
legend background
legend.key
element_rect()
background of legend keys
legend.text
element_text()
legend labels
legend.title
element_text()
legend name
Output to file
Use ggsave to output to a file and control its size
ggsave("baseplot.pdf",basePlot,width=6,height=4,units="in")
Tomorrow
The Lab Exercise for tomorrow will be a short quiz on Canvas dealing with different parts of the course. You will not need to be in the Lab to complete this assignment.
Lab time tomorrow will be devoted to completing the final project.
I will be in the Data Lab from 4PM to 9PM to consult on final project questions.