Environmental Data Analysis and Visualization
Warm-up exercise
On Canvas, there is a link to a survey for the ENVS Society. Please take a few moments to fill this out.
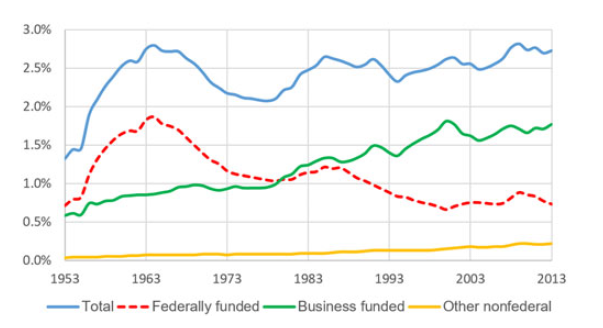
Visualization Critique
![]()
Some things I heard last night
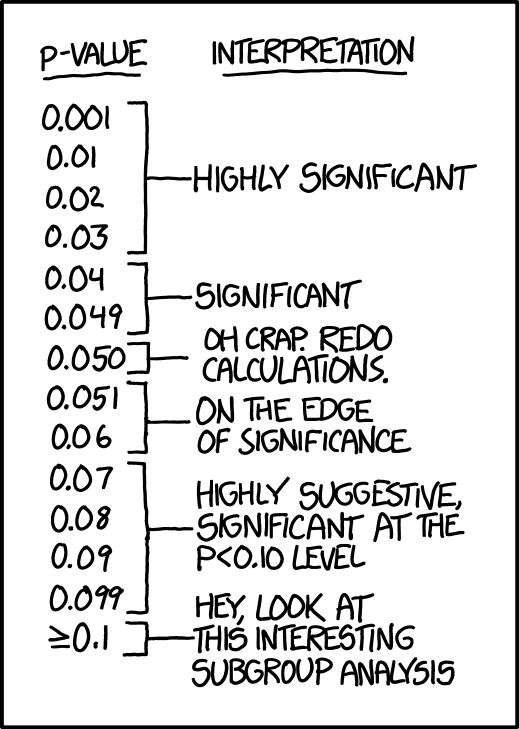
- Is it OK if I don’t have a significant relationship?
- Do I need to revise my project if I can’t answer my question with the data?
- What if my results don’t show anything exciting/interesting?
Science fails all the time
Science fails all the time.
Science fails all the time.
And that’s OK.
Does this mean I asked a bad question?
Does this mean I asked a bad question?
No.
Does this mean I asked a bad question?
No. Developing research questions takes time and practice. But they should never be asked with the expressed aim of getting a “significant” result.
Fail productively
A negative result is a result nonetheless.
If your assumptions/predictions didn’t work out, ask why not.
If your results are inconclusive, ask what data might be needed.
How does your result compare with other studies?
Fail productively, fail gloriously
“To fail productively, one has to be aware of the multiple contexts of that fail to find the valuable experience. To fail gloriously is to use the privileges that you have, as you are able, to make it safe for others to fail.” - Shawn Graham, Failing Gloriously
Reporting the results of a statistical test
When reporting the results of a statistical test, be sure to include the following information at a minimum within the context of the hypothesis:
Reporting the results of a statistical test
    Welch Two Sample t-test

data:  body_mass_g by species
t = -20.628, df = 170.4, p-value < 2.2e-16
alternative hypothesis: true difference in means between group Chinstrap and group Gentoo is not equal to 0
95 percent confidence interval:
 -1471.440 -1214.416
sample estimates:
mean in group Chinstrap    mean in group Gentoo
               3733.088                5076.016
Reporting the results of a statistical test
“I used Welch’s two-sample t-test of the body masses for Gentoo and Chinstrap penguins, and rejected the null hypothesis that there is no difference in mean body mass between these two groups (t=-20.62, df=170.4, p<2.2e-16).”
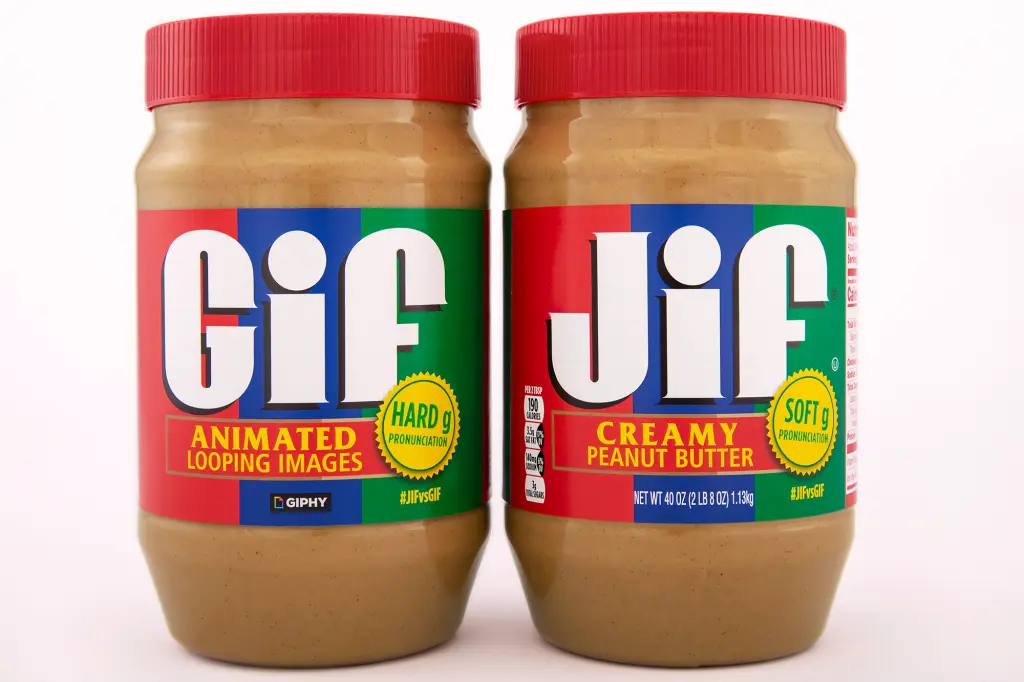
Bitmap vs Vector
![]()
Wilke, C. 2019. Fundamentals of Data Visualization
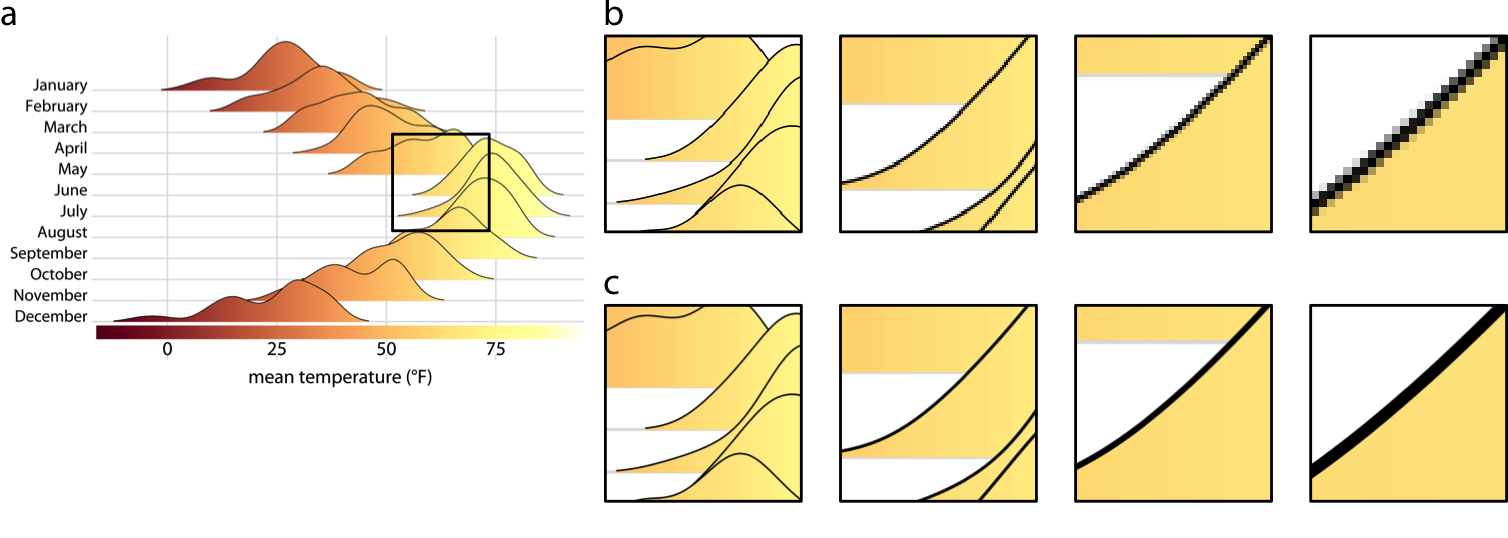
Bitmap vs Vector
![]()
Wilke, C. 2019. Fundamentals of Data Visualization
Bitmap vs Vector
Bitmap
Sharpness depends on resolution and size
Consistent appearance across platforms
Best for complex images (photos, large numbers of elements)
Vector
Sharpness is scale-independent
Can look differently using different programs
Best for simple images (line drawings, simple graphs)
Next week
Tuesday: Final lecture
Wednesday: Final final project development session
Thursday: SUBMIT POSTERS BY NOON, present at 4:30 PM