Week2Lecture3
Activity: Week 1 Review
Please open RStudio, create a new R script, and then add code to the script to do the following:
Generate a vector of 1000 random numbers using the
rnormfunction, with a mean of 4 and a standard deviation of 2, and save it to a variable called x1.Using the
repfunction, generate a separate vector of 100 instances of the number 9, and call it x2.Combine x1 and x2 into a single vector called data.
Create a histogram of the data vector. Modify the col argument to choose a color that you prefer.
Make sure to include comments explaining the code to a user.
What do you notice about the histogram? Any patterns? If this were real data, what might you think?
Sensor of the day
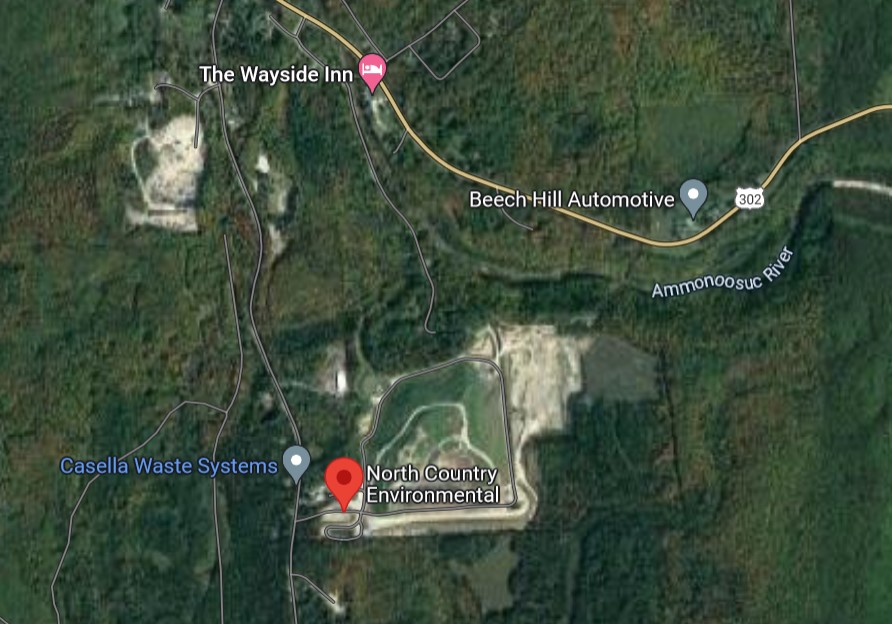
Remote sensing of emissions
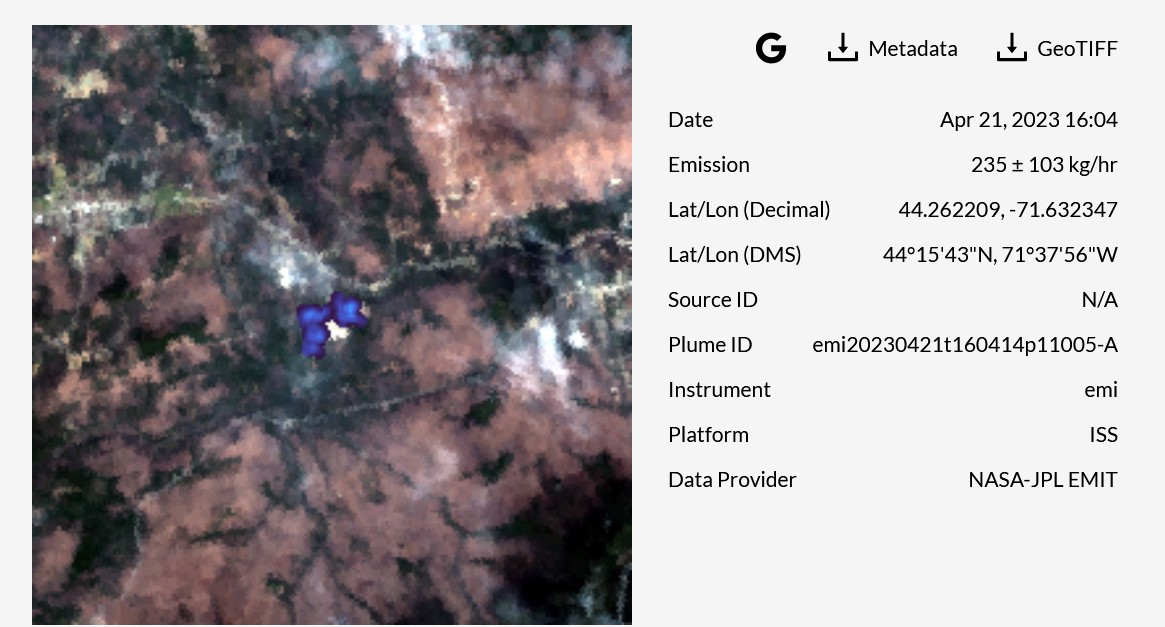
Sensor of the day
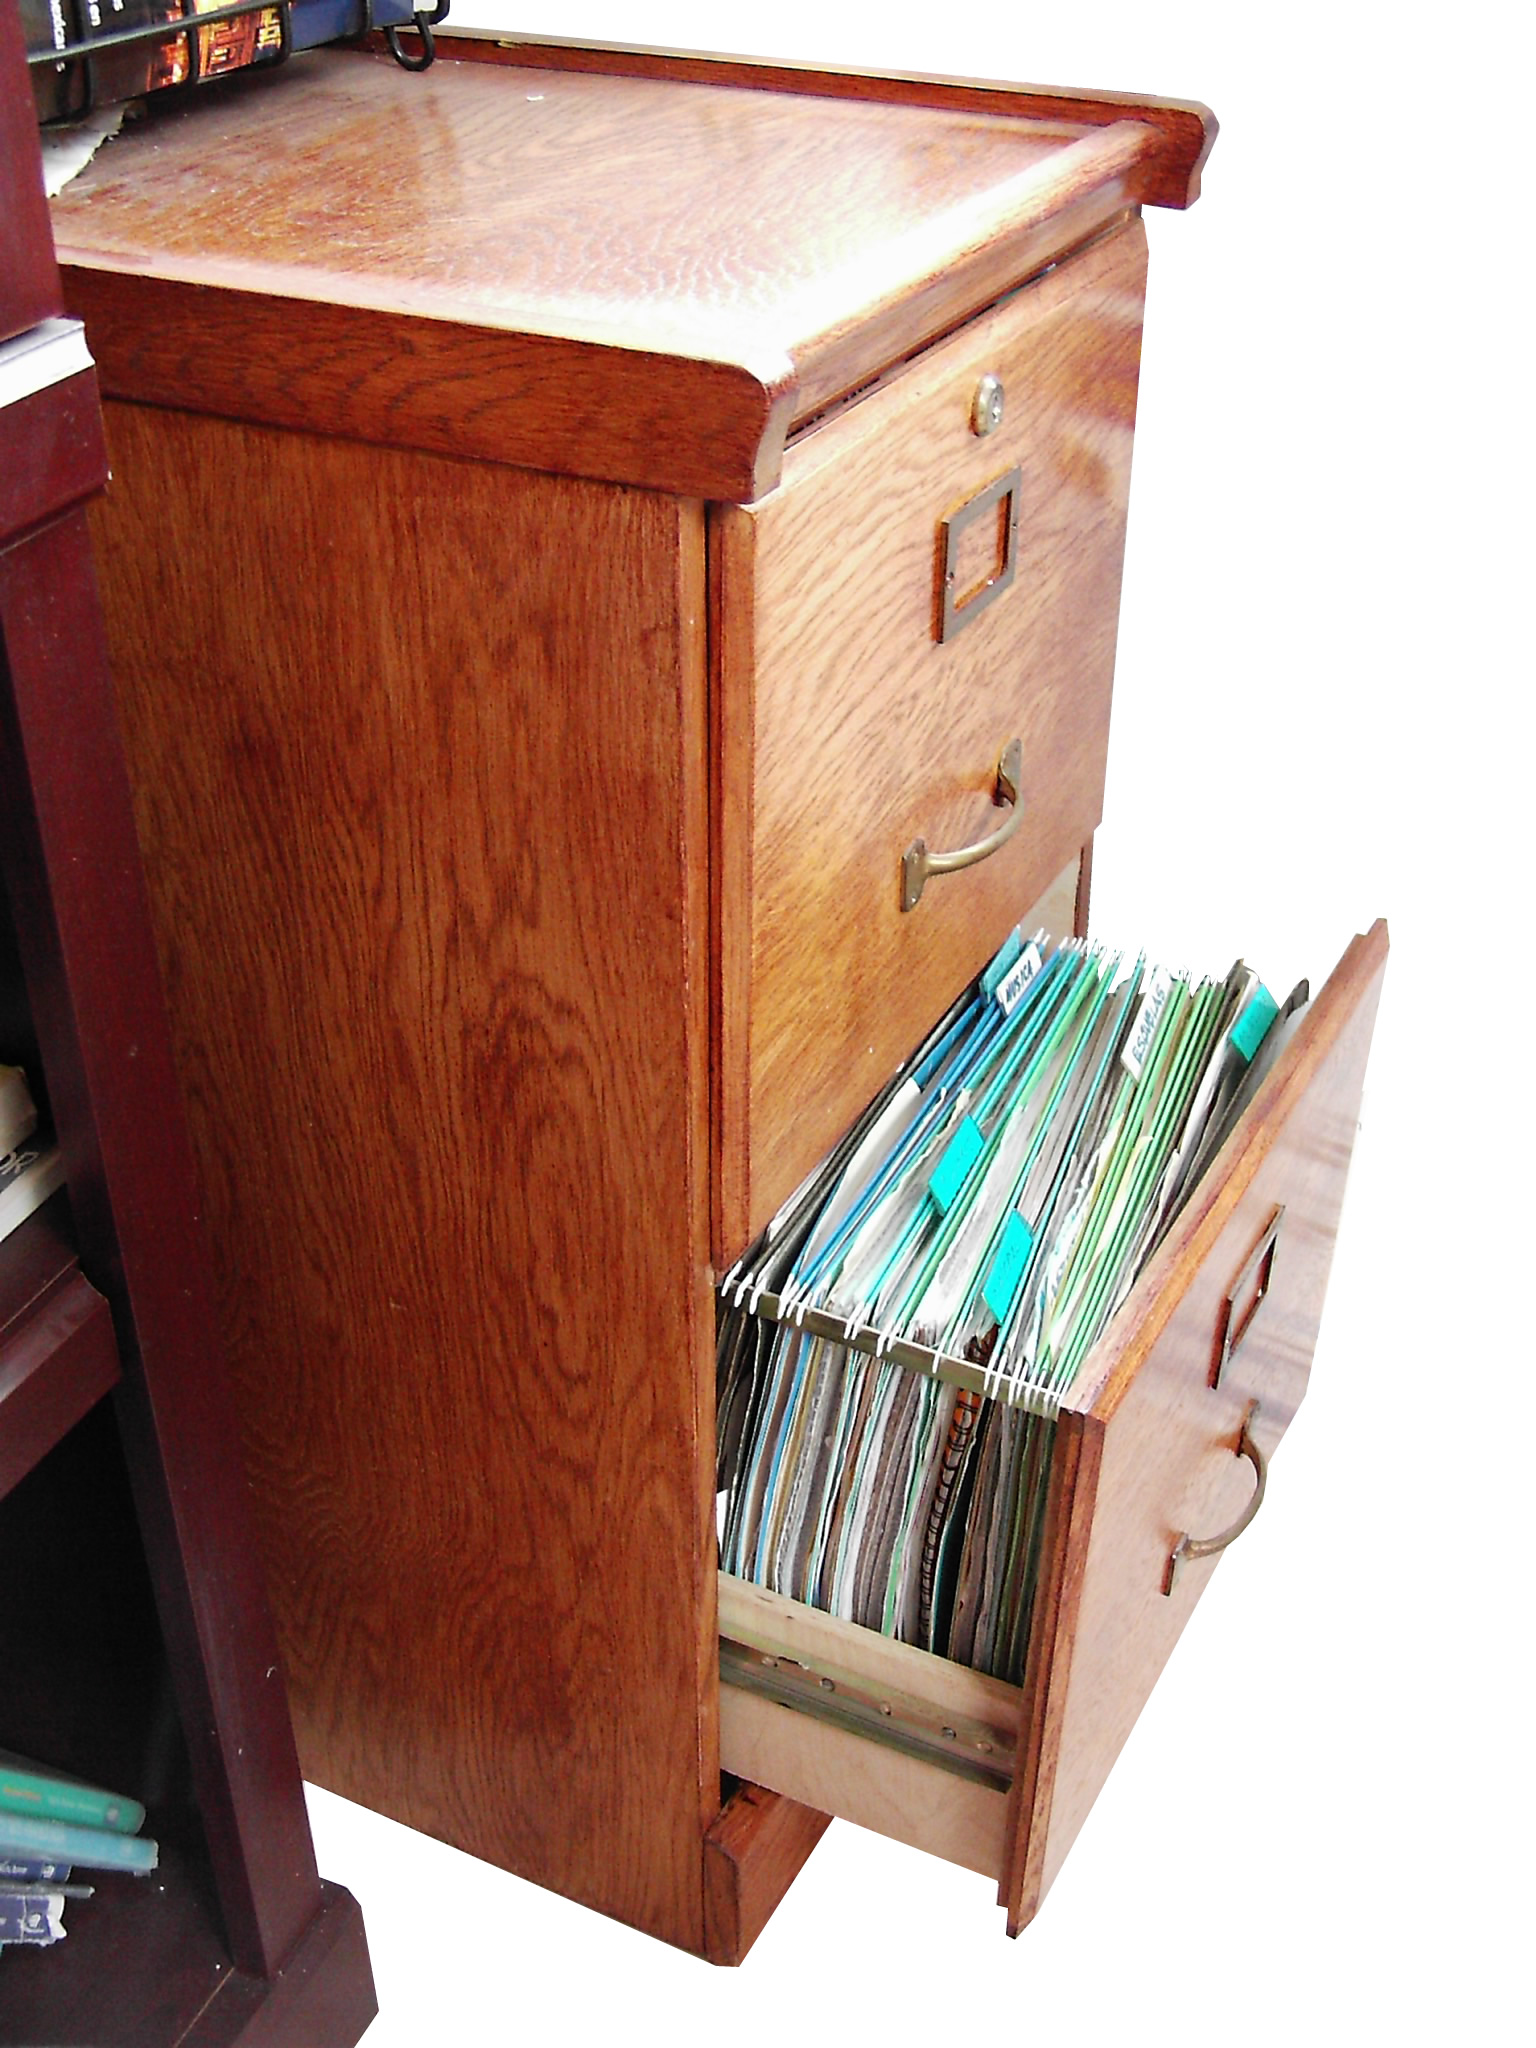
File systems
The file system is a means of storing and retrieving files on a computer. Many systems are based on a hierarchical collection of directories.

Thinking about file systems
By Pptudela at the English-language Wikipedia, CC BY-SA 3.0, https://commons.wikimedia.org/w/index.php?curid=14530617
Reasons for keeping files organized
Makes it easier for you to find and update files
Makes it easier for others to understand the logic of the project
Ensures files can be located without user input
Location, location, location
You want it to be somewhere where you will be able to find it easily and access it.
Avoid working exclusively from a removable drive that could get lost
It can help to store things in a cloud-based drive, but beware of using shared folders
Organizing by attributes
Project-based
Box\Courses\ENV170\CodingExercise1\…
Time-based
Box\Courses\ENV170\Week 2\…
Theme-based
Box\Courses\ENV170\SpatialAnalysis\…
Project directory structure
You can structure your directories in a number of different ways. Data science practitioners often suggest variations on the following theme:
A main directory (folder)
A subdirectory for keeping data files
- This might also include subdirectories for raw and processed data
A subdirectory for keeping code files
A subdirectory for keeping output files
Activity: Your file system
Create a file system for saving your work this week. If you’ve already got one going, see how it compares with our discussion so far and think about whether this would be a good time to reogranize.
Think about the following
Will you be able to find it easily?
Will someone else be able to understand how this folder structure works?
Once you’ve done this, go to the File drop-down menu in RStudio and select Save As to store your script inside the appropriate folder for this week’s lecture
Tips for naming files and folders
Avoid spaces
- Use camel case (myLabExercise) or snake case (my_lab_exercise)
Avoid special characters
- ~ ! @ # $ % ^ & * ( ) ` ; < > ? , [ ] { } ’ “ |
Try and keep them short
Avoid the term final (e.g., code_exercise_3_finalFinal.R)
- Instead, use version numbers or dates (e.g., YYYY-MM-DD)
Above all else… BE CONSISTENT!
Recommended practices
Do not modify your raw data manually, or even better, at all.
Data manipulation should work like a conveyor belt: it stops at checkpoints. E.g., it gets modified/cleaned/analyzed, and then it moves on.
Always have collaborators in mind. Work towards shareable code. Have public awareness.
Consistency (within your project) is key.
Activity: Working with collaborators
Submit your script from today’s opening activity to the Lecture 3 File sharing assignment on Canvas
Once everyone’s script has been submitted, you should be able to access another classmate’s script via peer review (if not, I have a backup option)
Download your classmate’s script, save it to the appropriate place in your file system, open it in RStudio, and run it!