Environmental Data Visualization and Analysis
Quick review
What can we do to improve this code?
#create a variable of 500 numbers from a standard normal distribution
x<-rnorm(0,1)
#create another variable from the same data but squared
x^2
#make it into a scatter plot
scatterplot(x,y)
Quick review
What can we do to improve this code?

Quick review
What can we do to improve this code?

Sensor of the day
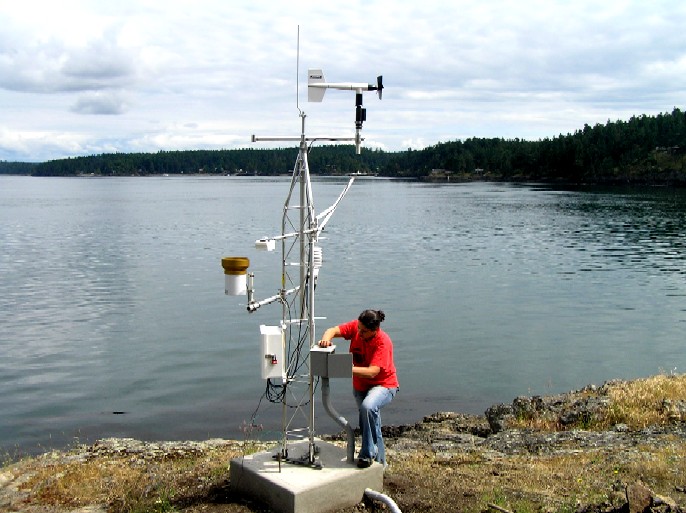
Weather stations!

Sensor of the day

Sensor of the day
Instruments may include:
Thermometer: Temperature
Rain gauge: Precipitation
Barometer: Atmospheric pressure
Anemometer: Wind speed
Wind vane: Wind direction
Pyranometer: Solar radiation
Finding data
The main assignment for this course will involve conducting your own data analysis and visualization using data of your choice.
That data is out there, somewhere, waiting for you…
What kind of data?
Data are most useful when they are in machine-readable formats
- .csv, .tsv, .txt, .ncdf, .jpg, .tiff, .xml, .kml, .shp

What kind of data?
Data are most useful when they are in non-proprietary, widely-used formats

Activity: Take the Weather With You
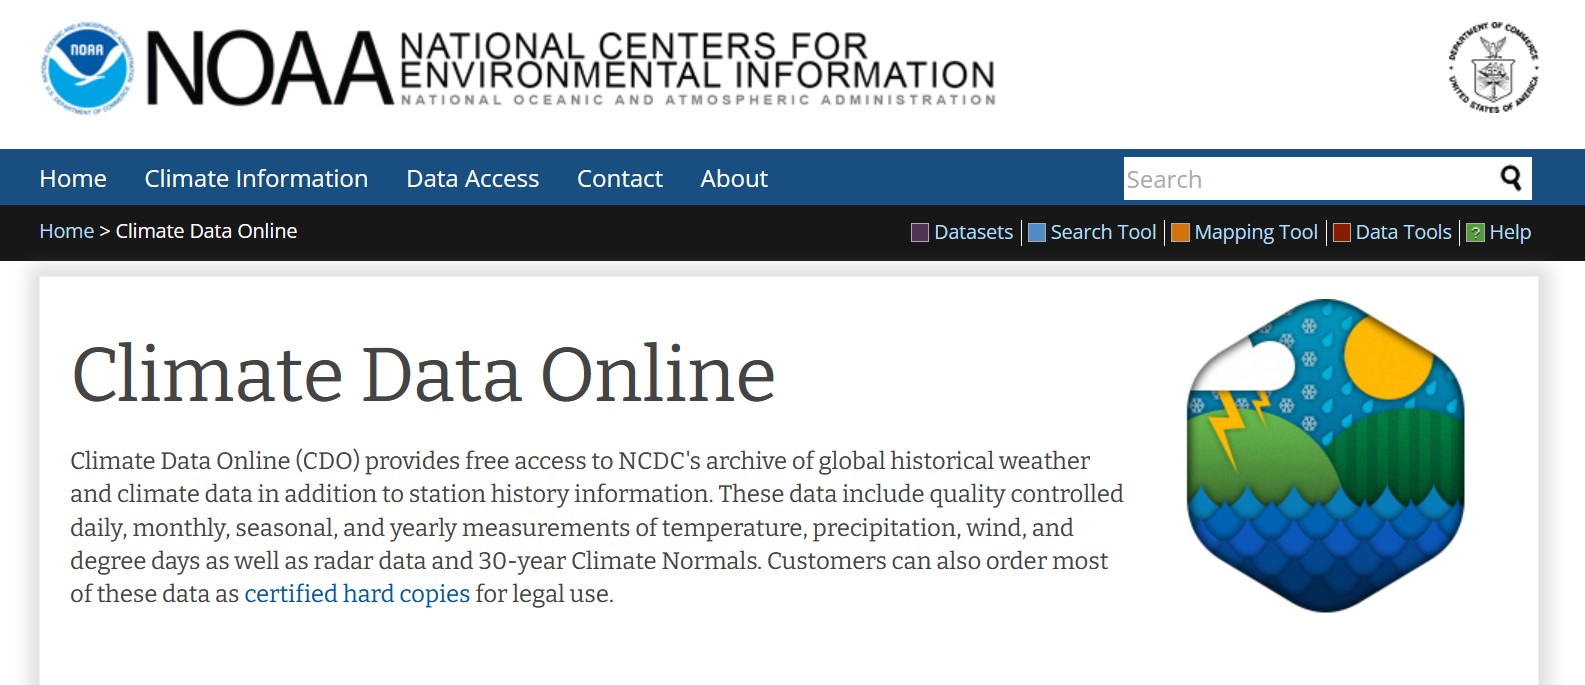
Visit the Climate Data Online portal: https://www.ncei.noaa.gov/cdo-web/
Choose Browse Datasets, expand Daily Summaries, then click Search Tool
Search for station data in any part of the world and add it to your cart
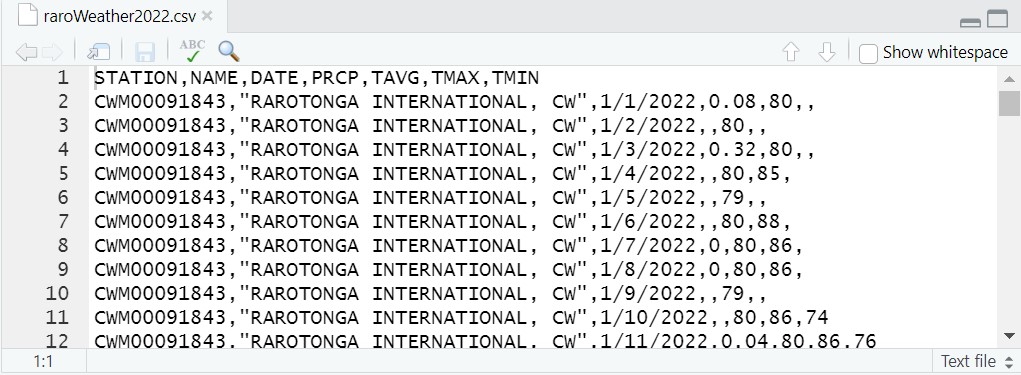
Select the option to download a Custom GHCN-Daily CSV and choose the data types you want to include
Download it to your computer, move it to the appropriate spot in your file system, then read it into R using
read_csv
Reliable sources
Primary data often come from government clearinghouses (.gov), research institutions (.edu), or from non-governmental organizations (.org)
Published alongside research publications (Figshare, Zenodo, etc.)
Data that you or someone you know collects
Metadata
Metadata are data about data.

Metadata
Metadata are data about data.
These are tell us things like how the data were collected, by whom, when, how it is structured, etc.
Examples of metadata
Example 1: CDO Daily Sumamries
Example 2: USGS Earthquake Archives
Activity: The hunt for more data
On Canvas, there is a page listing data sources you might use in this course.
Choose 2 sources of interest and download some data, ideally stored in .csv or similar, but if it’s something else we can try and figure it out
Store the data somewhere that makes sense for your file system so you can come back to it.
Be prepared to answer the following questions:
What was the data?
How easy was it to figure out the interface? Did anything trip you up?
Were there any metadata that accompanied the data?
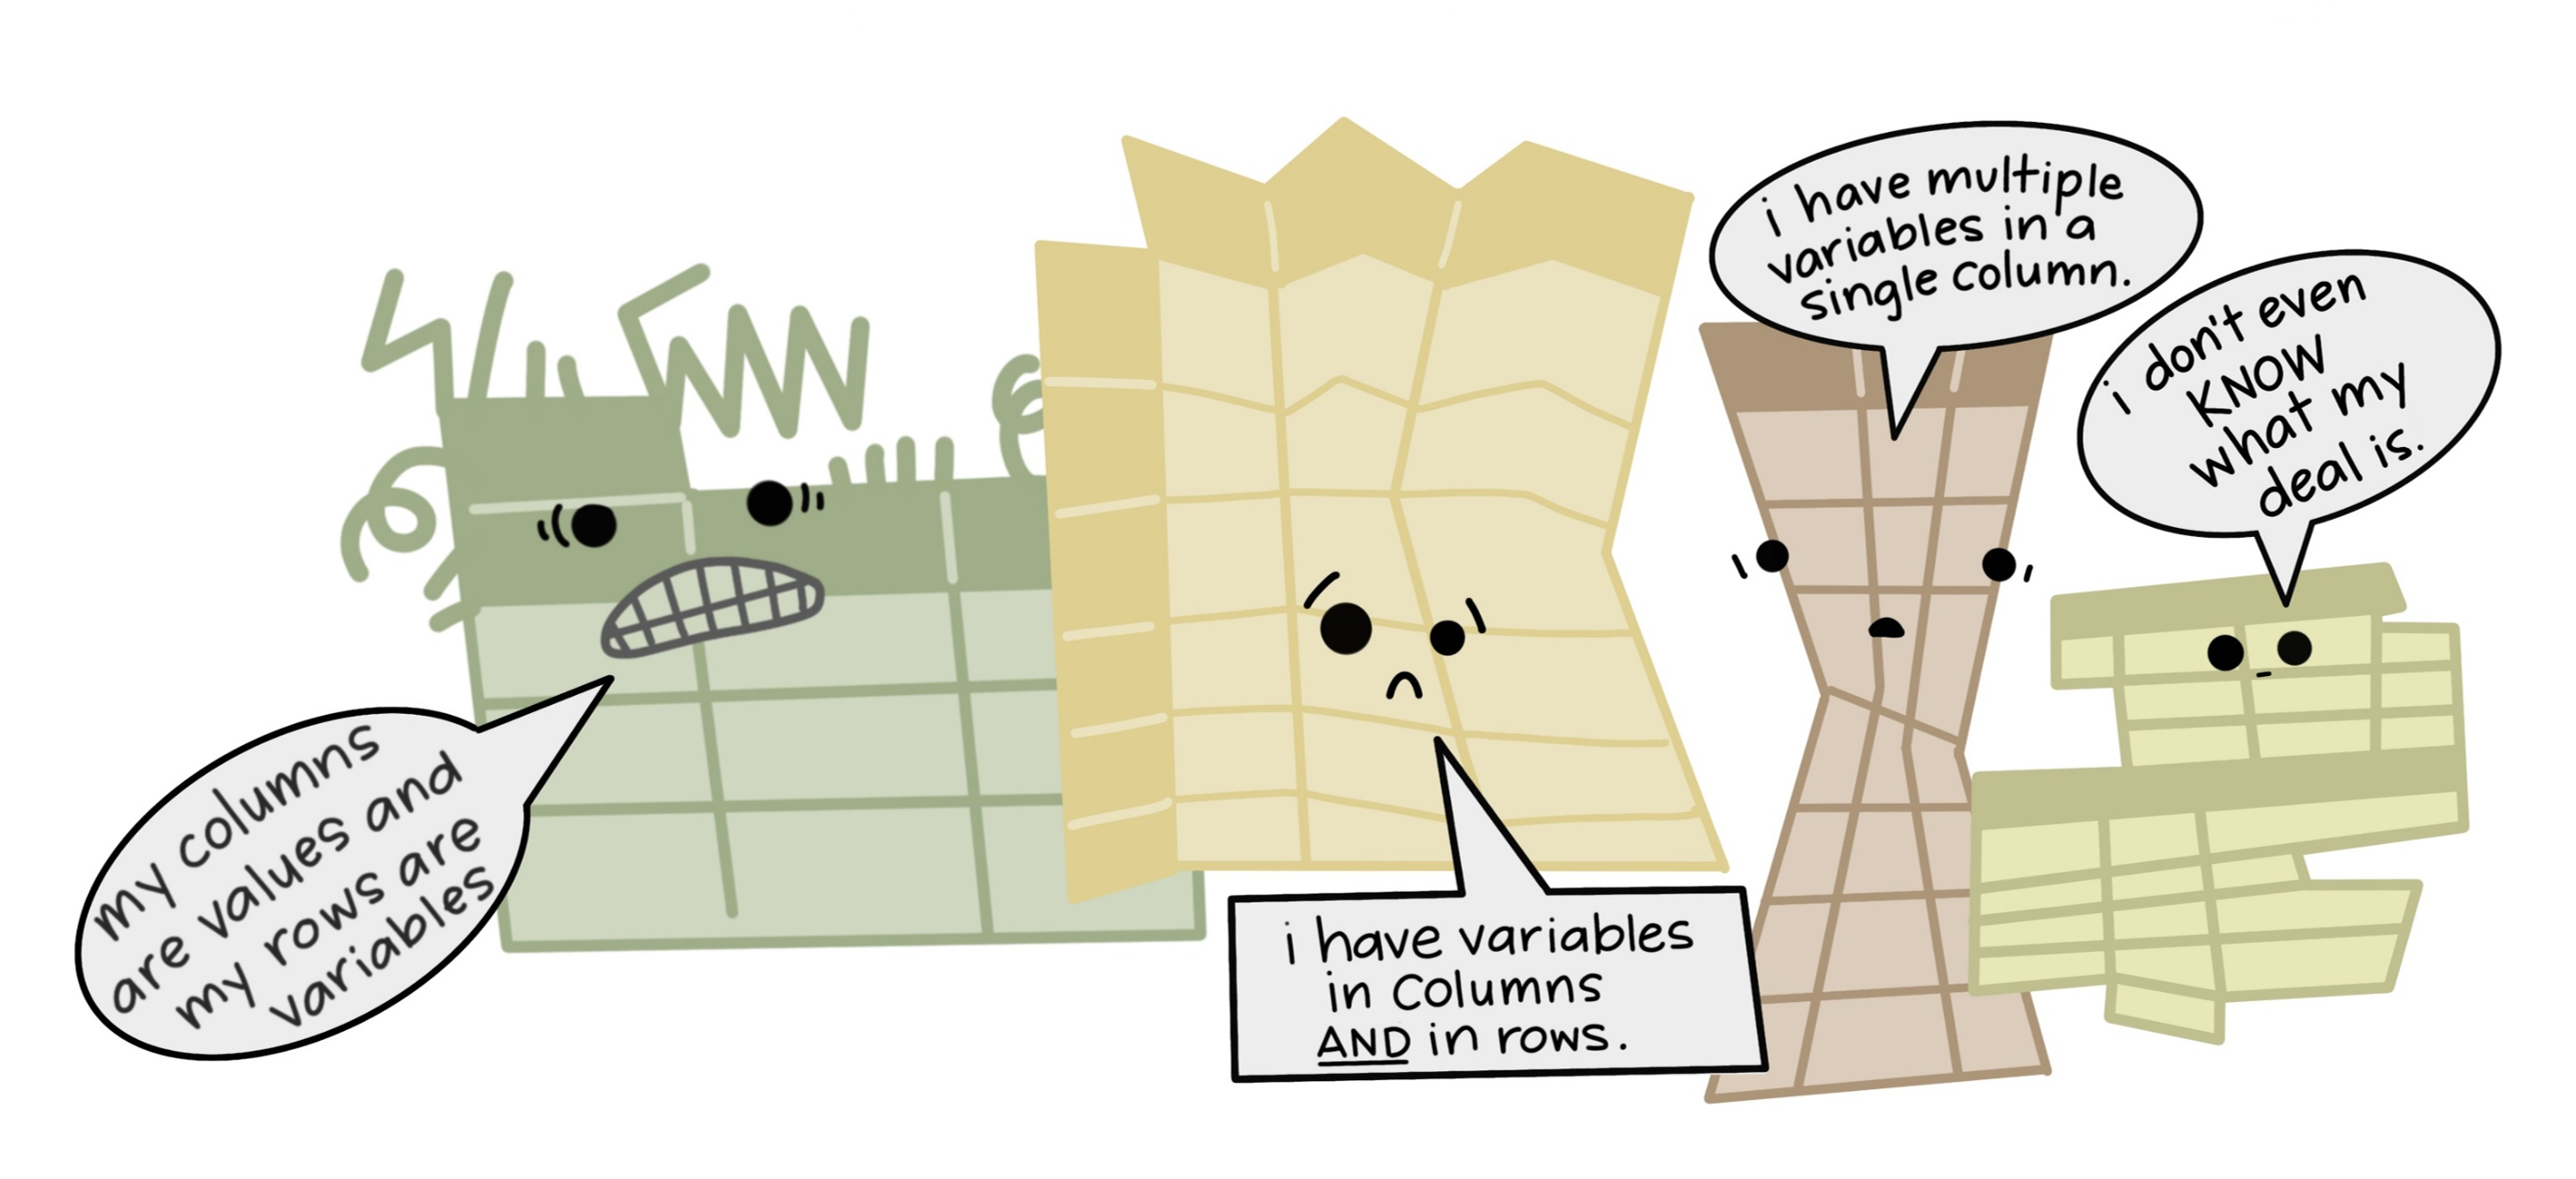
Messy data
Data often comes with issues caused by data entry error, poor data management decisions, or

https://openscapes.org/blog/2020-10-12-tidy-data/
Next week
What makes a good visualization?
Visualizing quantities and distributions
Introducing ggplot2 and the grammar of graphics