Where you add your aesthetic mapping will determine what geometries they connect to
Where you add your layers will determine their order of drawing
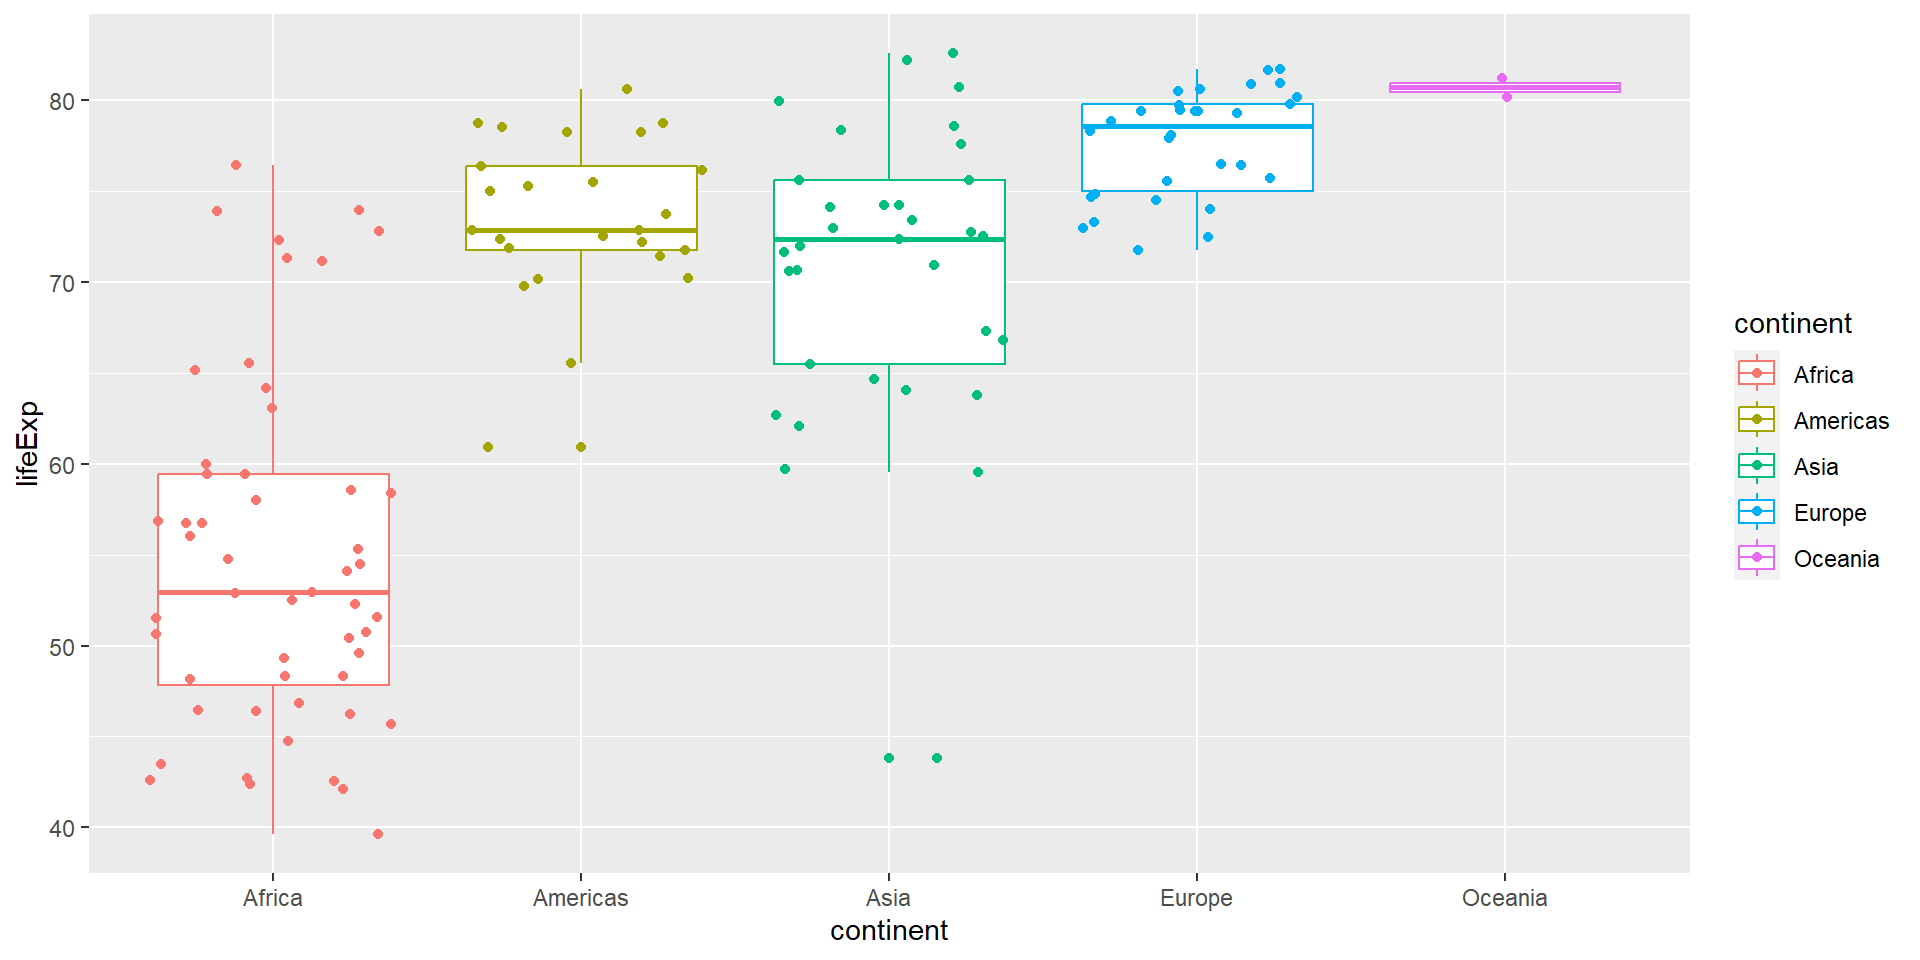
When does this matter?
ggplot(data=gm2007,aes(x = continent, y = lifeExp, color = continent)) +geom_boxplot() +geom_jitter()
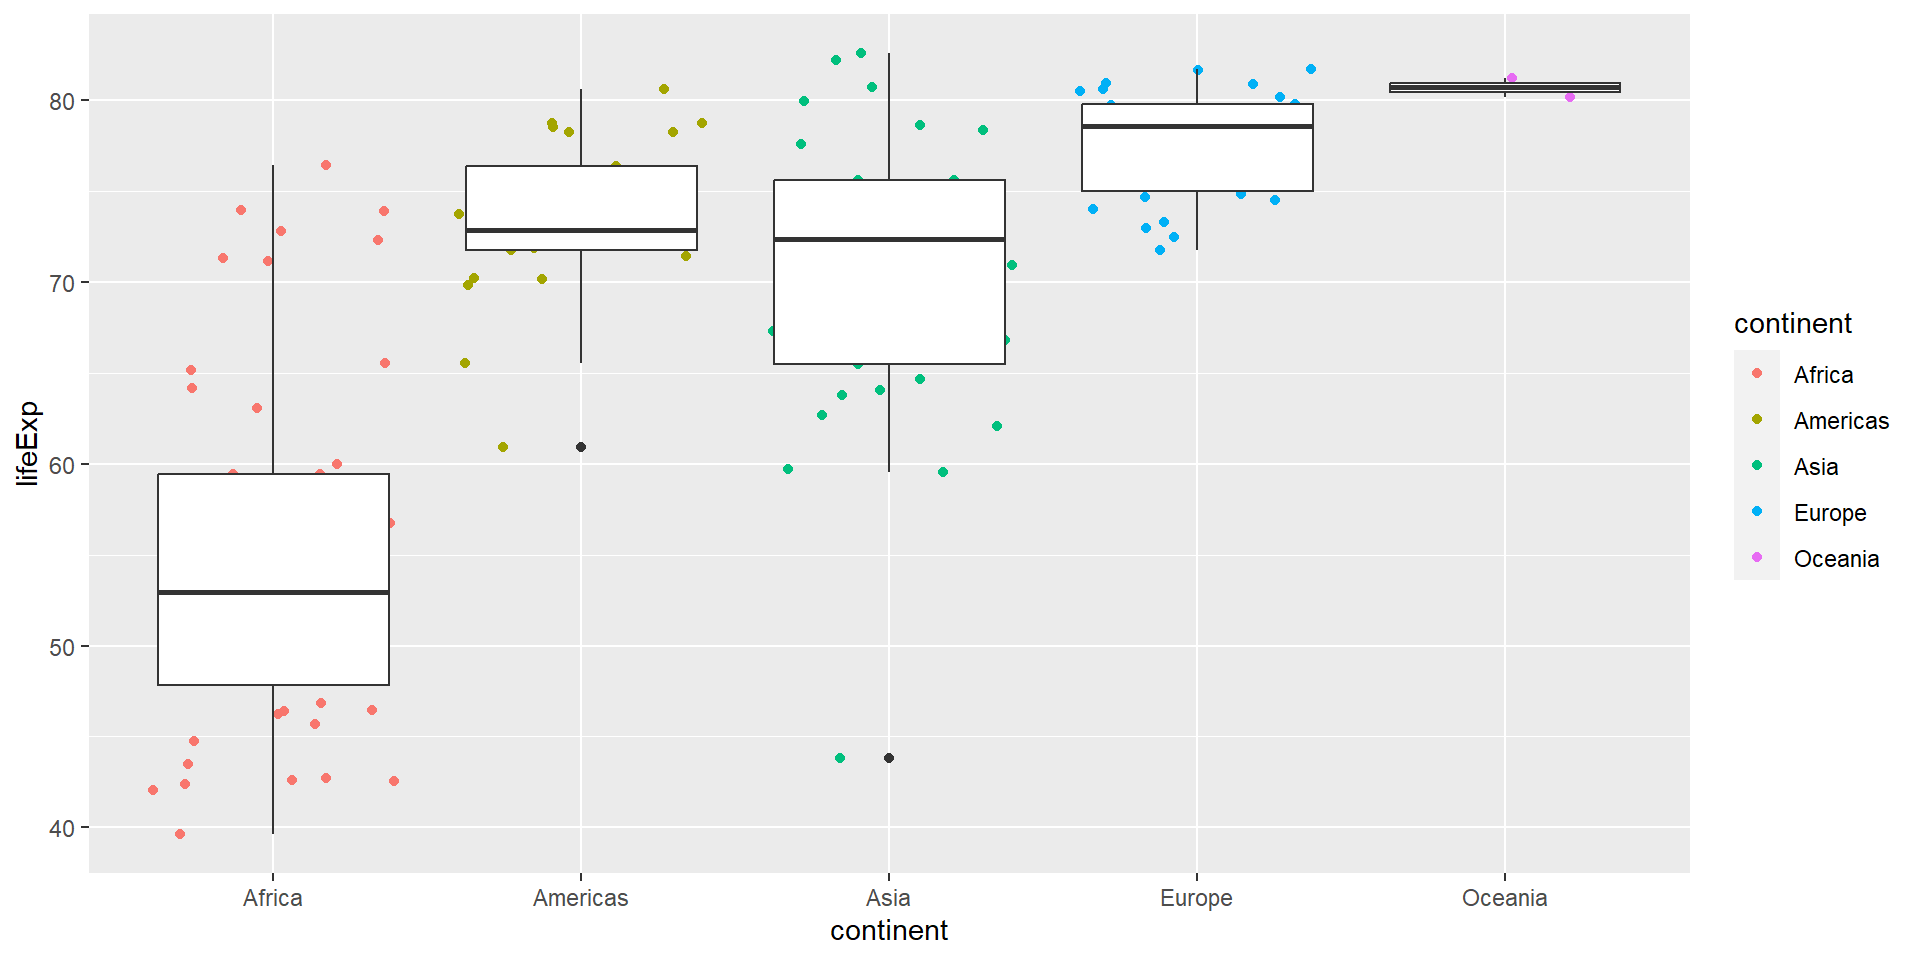
When does this matter?
ggplot(data=gm2007,aes(x = continent, y = lifeExp)) +geom_jitter(aes(color = continent)) +geom_boxplot()
How to make a good visualization
Choose the right chart for the data
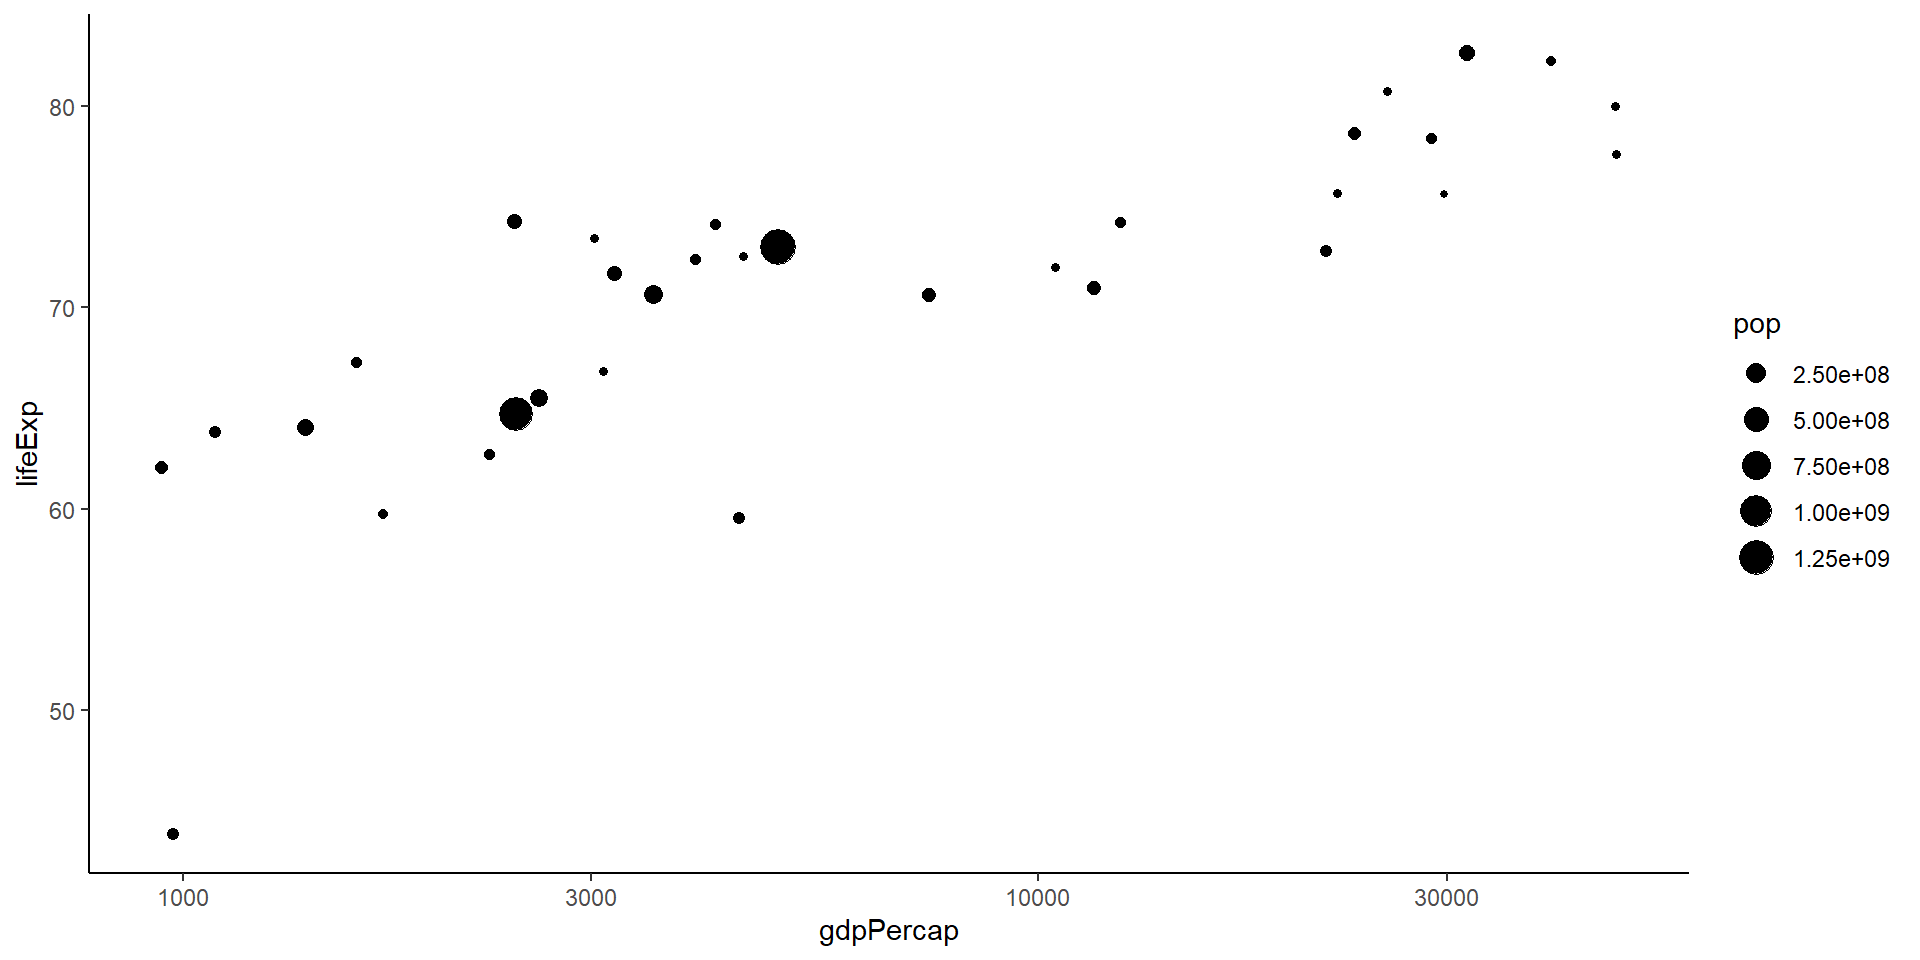
Maximize the data-to-ink ratio
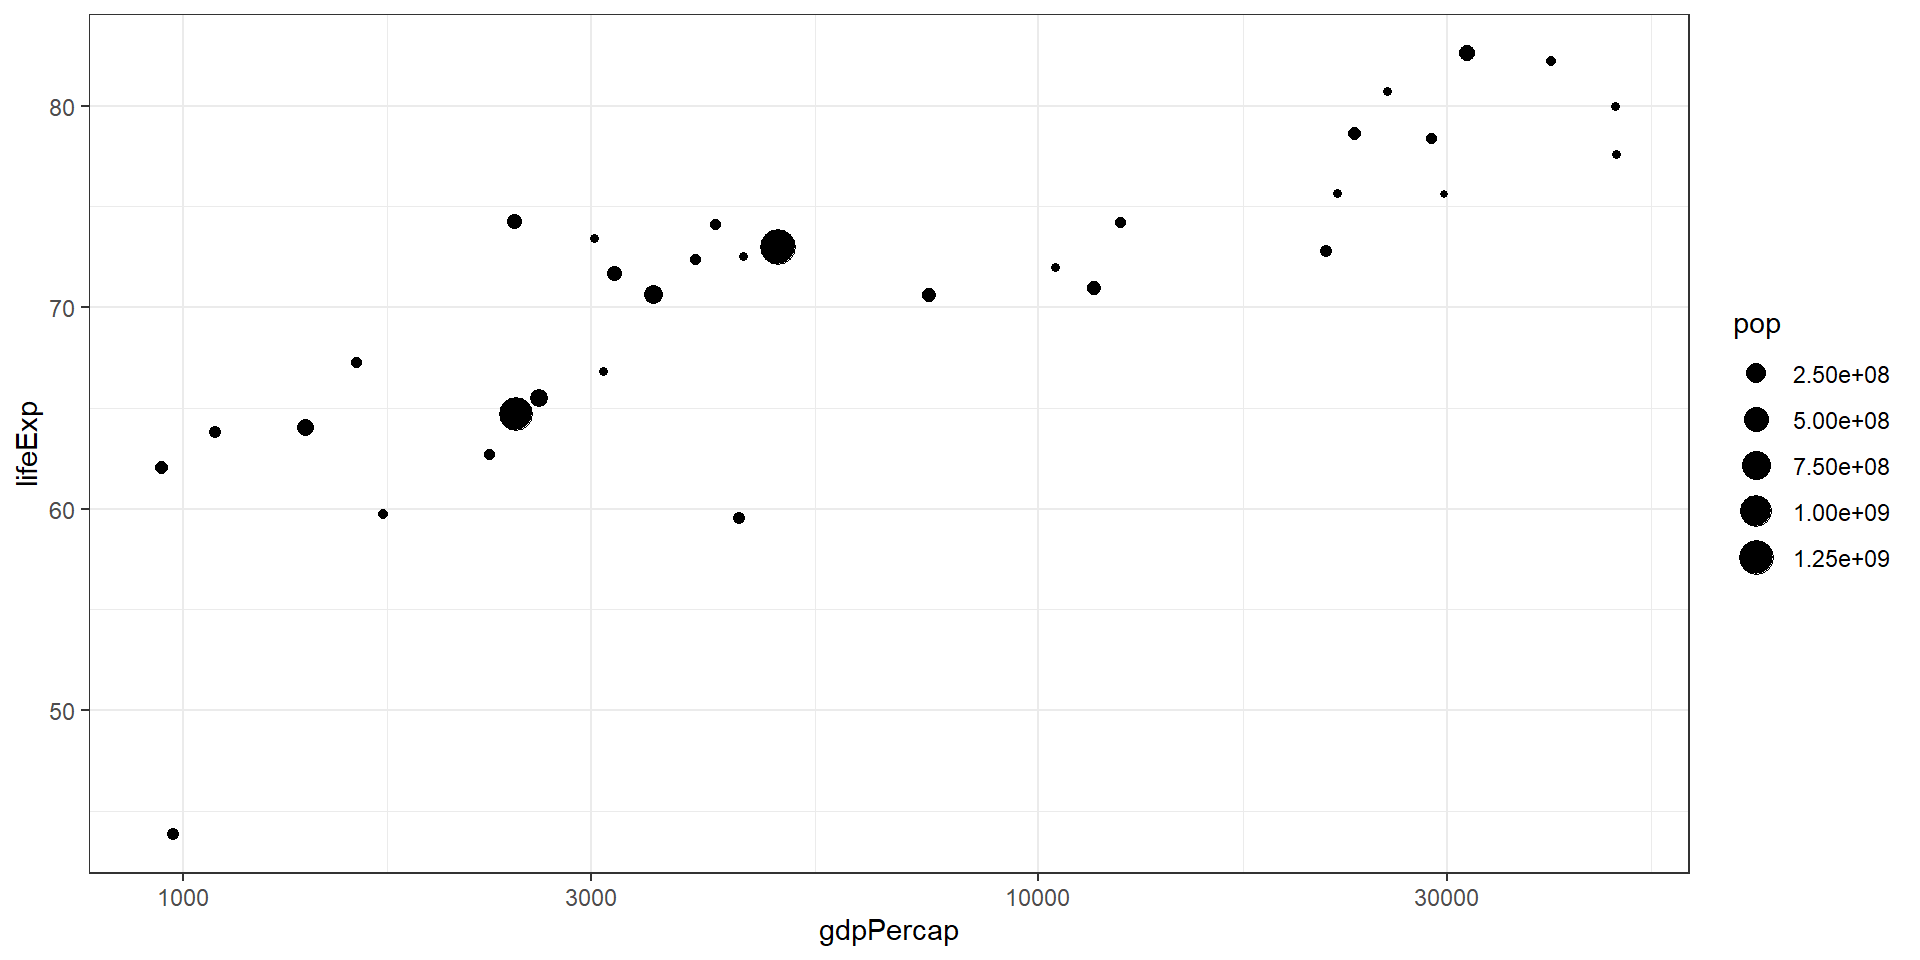
Make deliberate design decisions
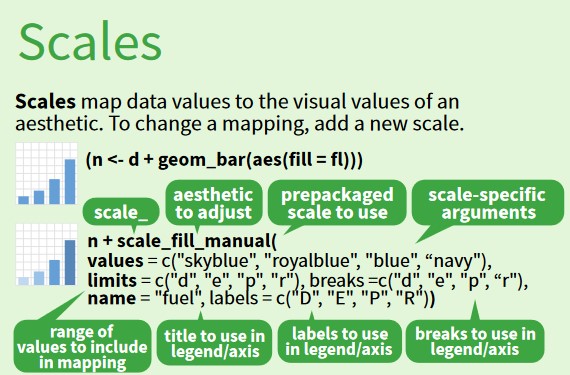
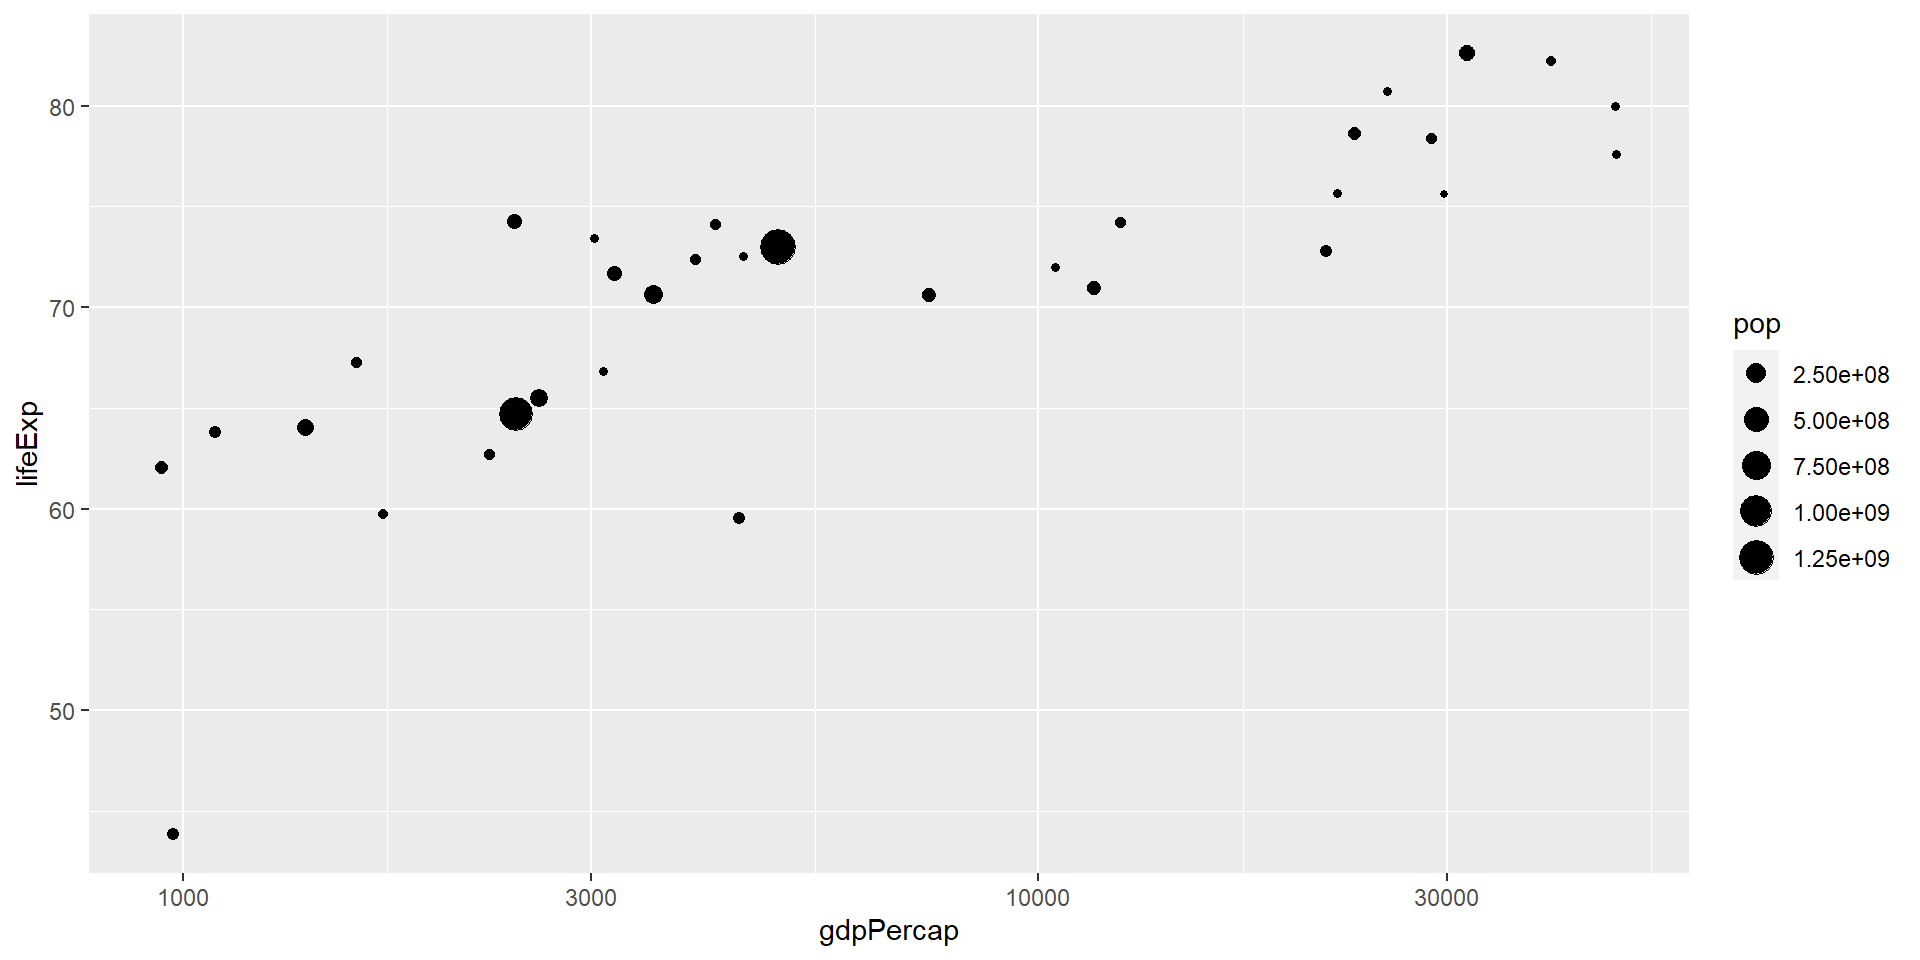
Scales
Scales: Being deliberate with color
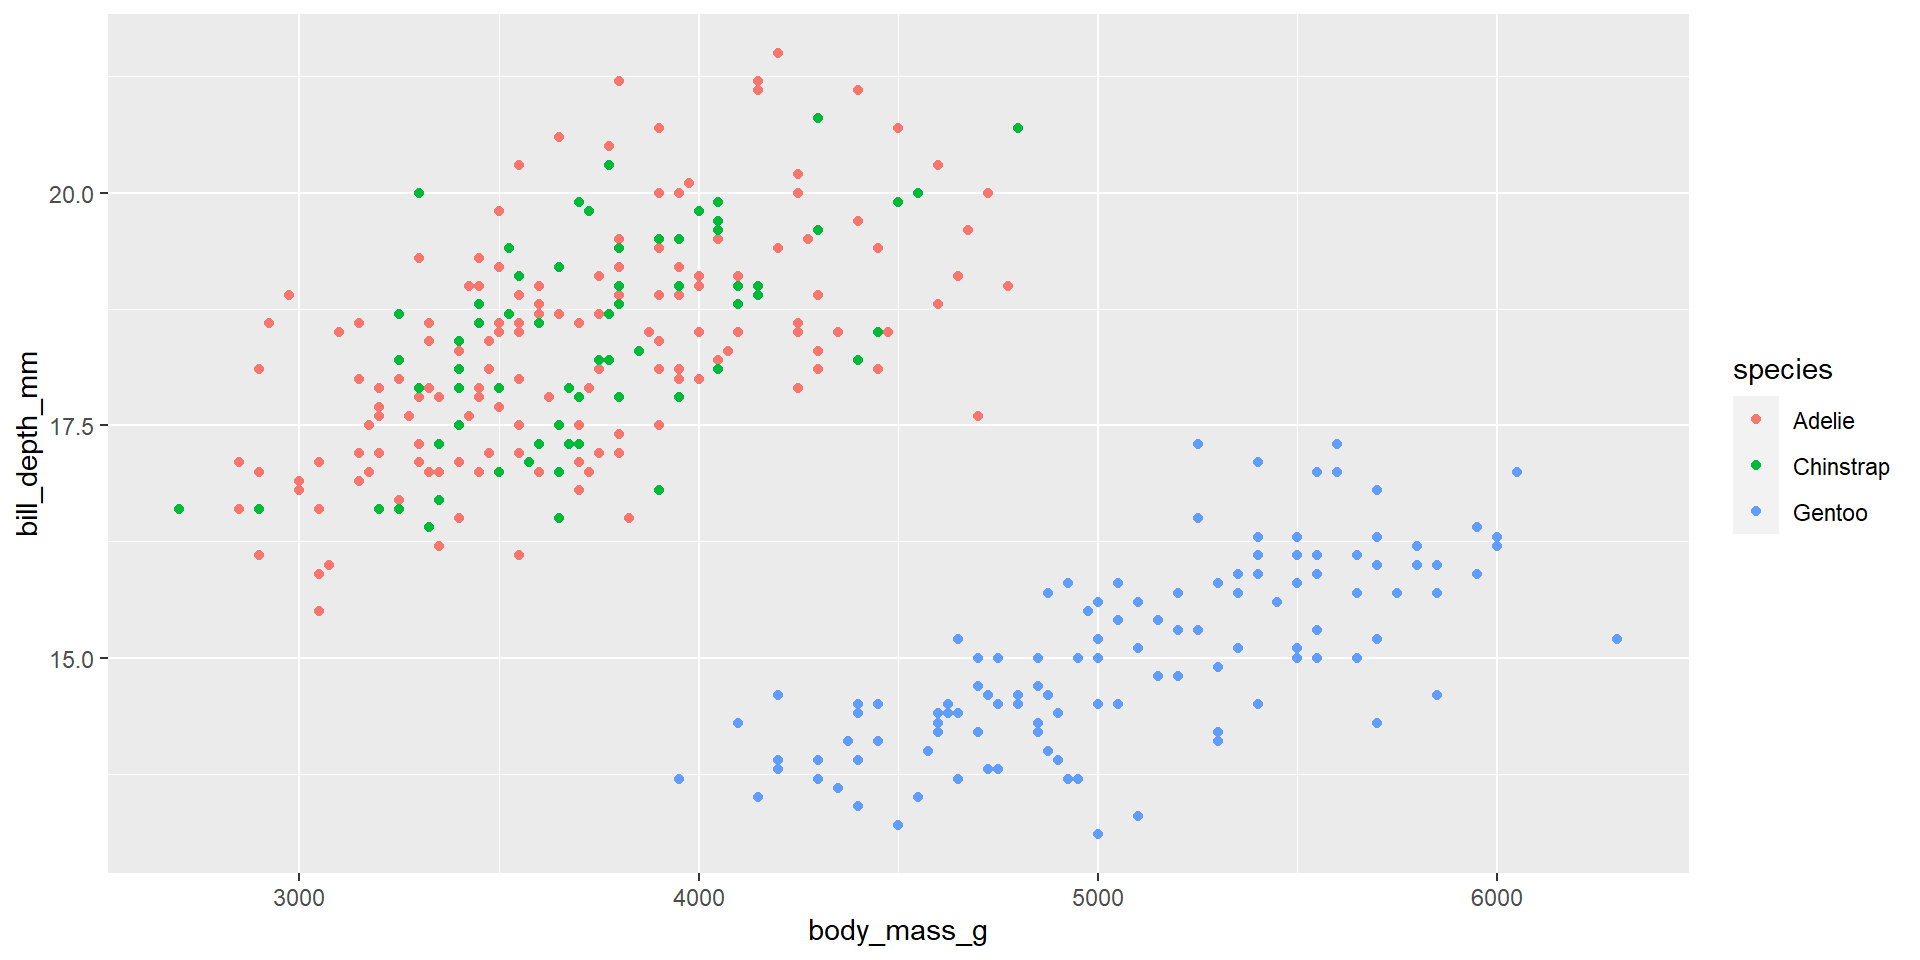
What can color show effectively?
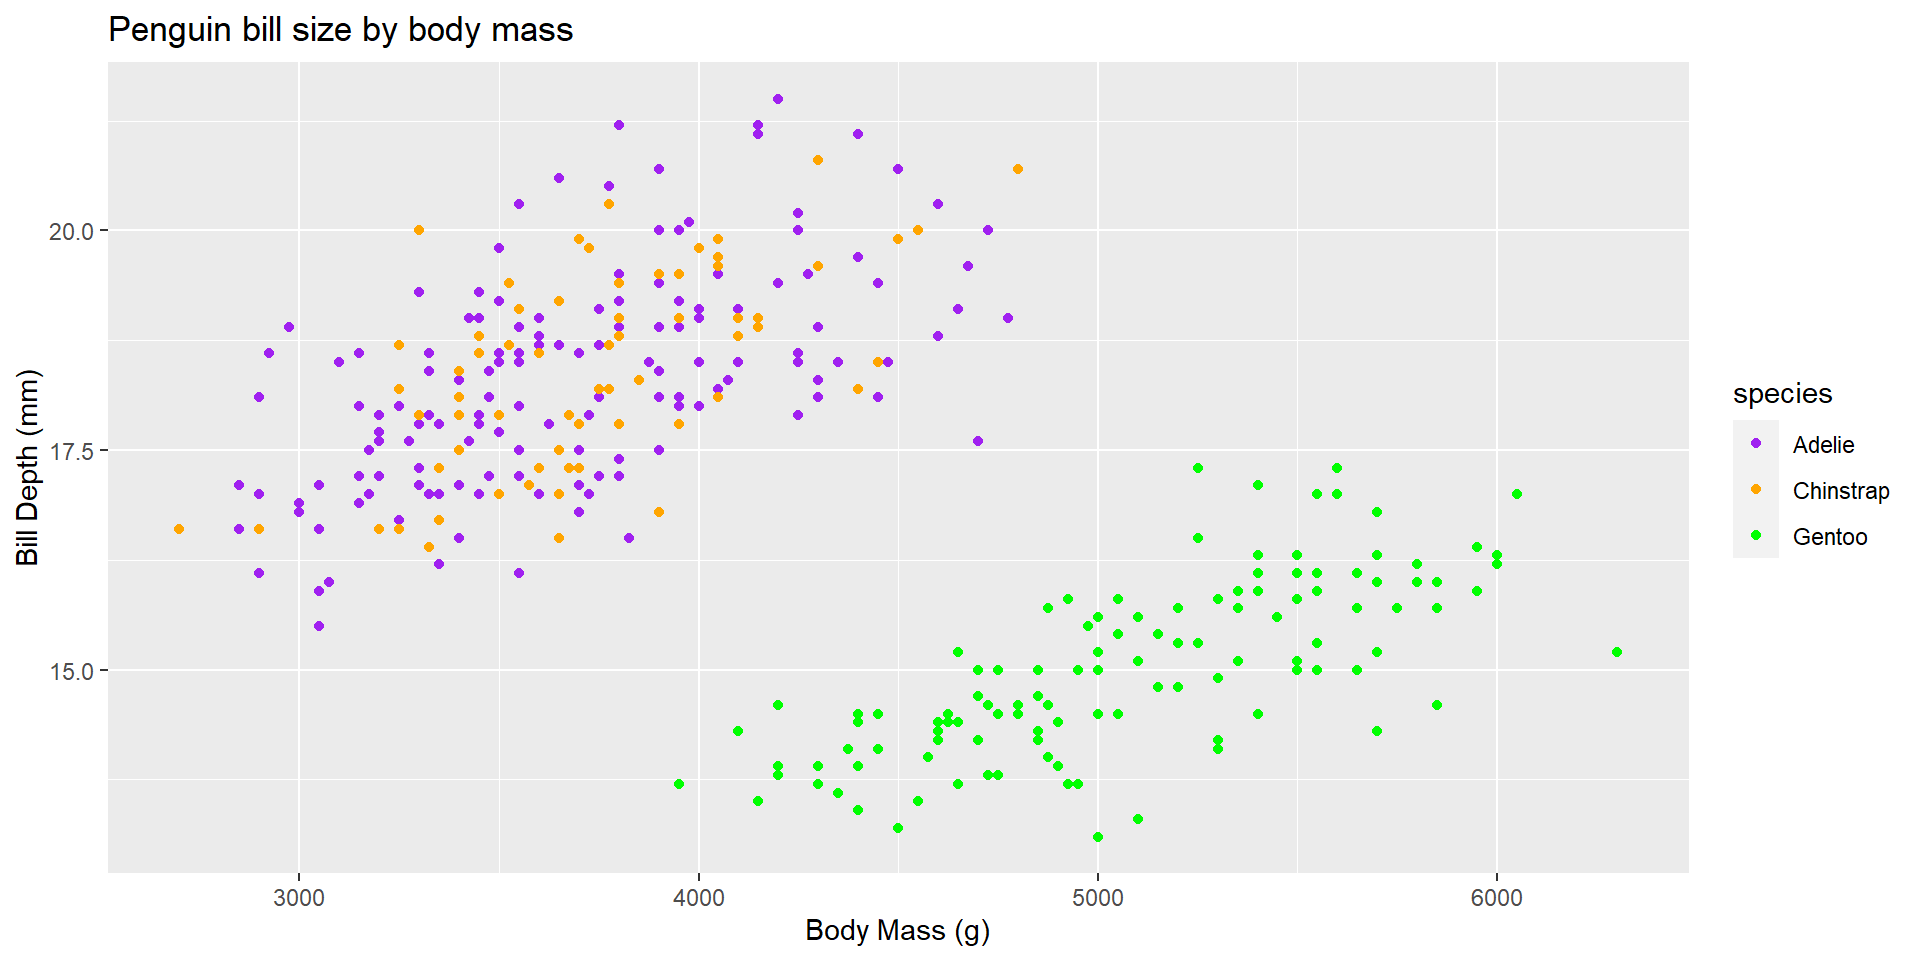
Scales: Being deliberate with color
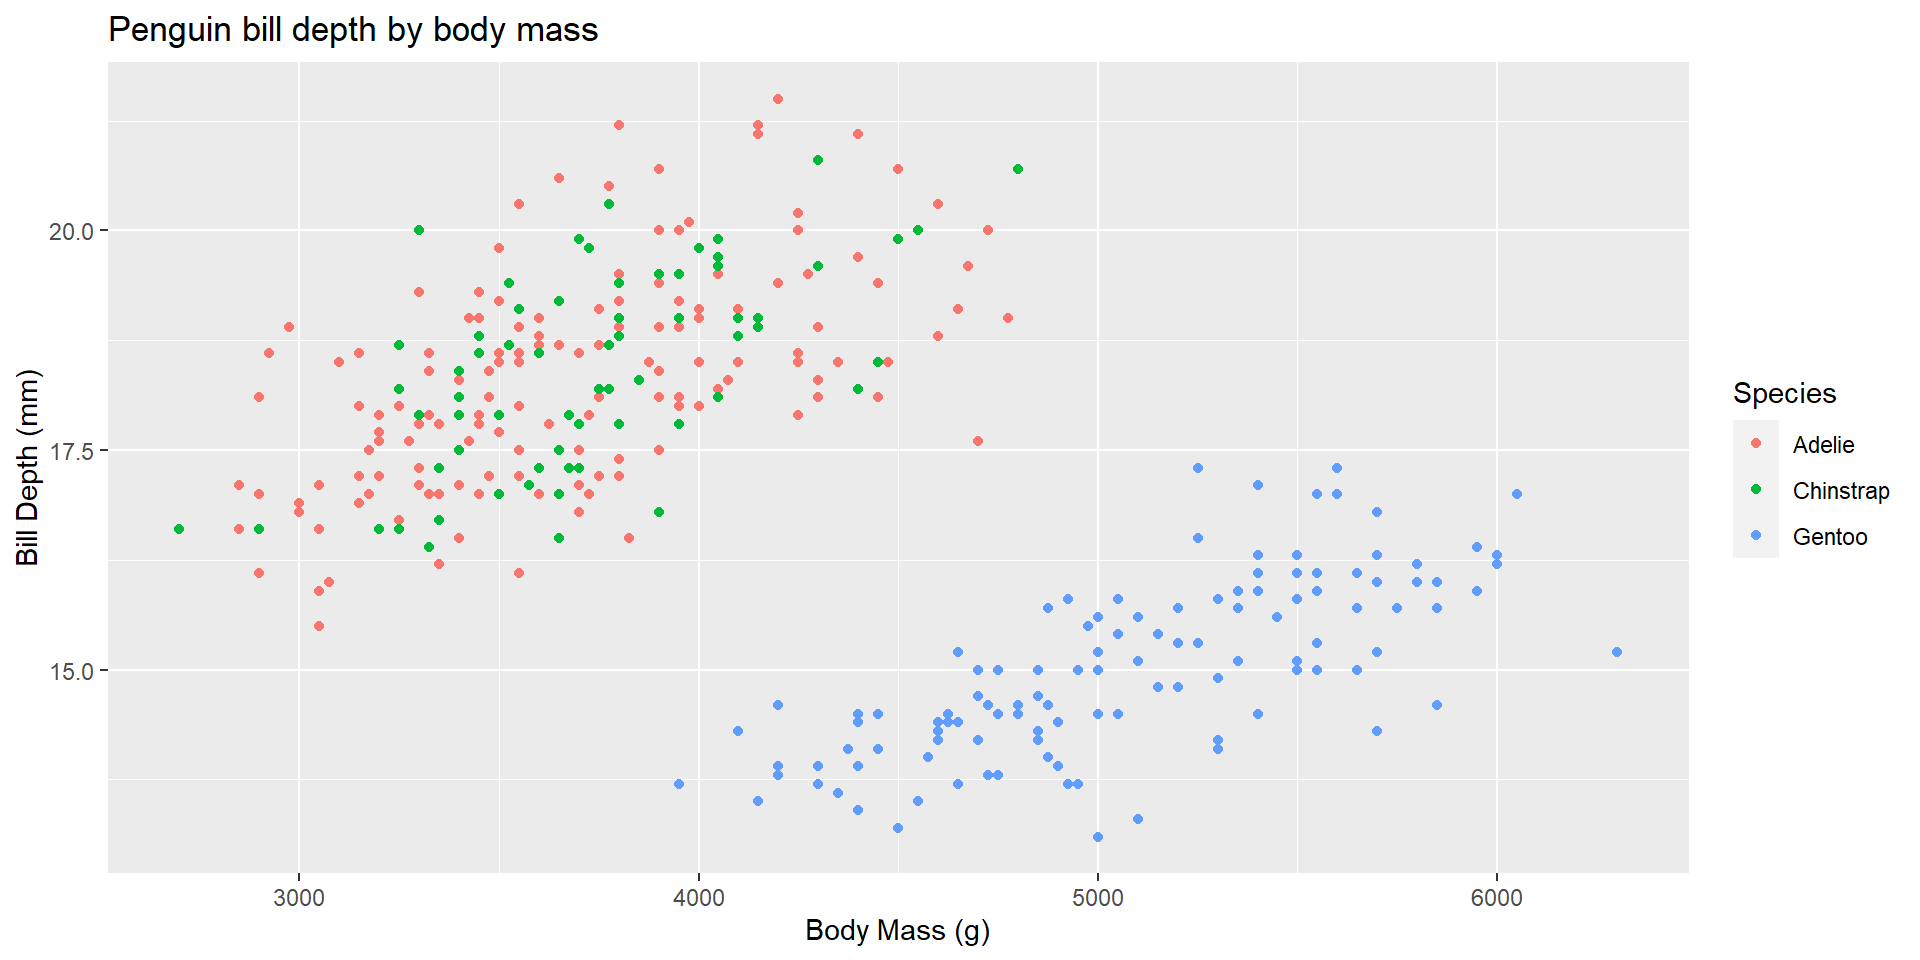
ggplot(penguins,aes(body_mass_g,bill_depth_mm,color=species))+geom_point() +labs(x="Body Mass (g)",y="Bill Depth (mm)",title="Penguin bill size by body mass") +scale_color_manual(values=c("Purple","Orange","Green"))
Scales: Being deliberate with color
library(ggthemes)cvdCols <-c("#000000", "#E69F00", "#56B4E9")ggplot(penguins,aes(body_mass_g,bill_depth_mm,color=species))+geom_point() +labs(x="Body Mass (g)",y="Bill Depth (mm)",title="Penguin bill size by body mass") +scale_color_manual(values=cvdCols)
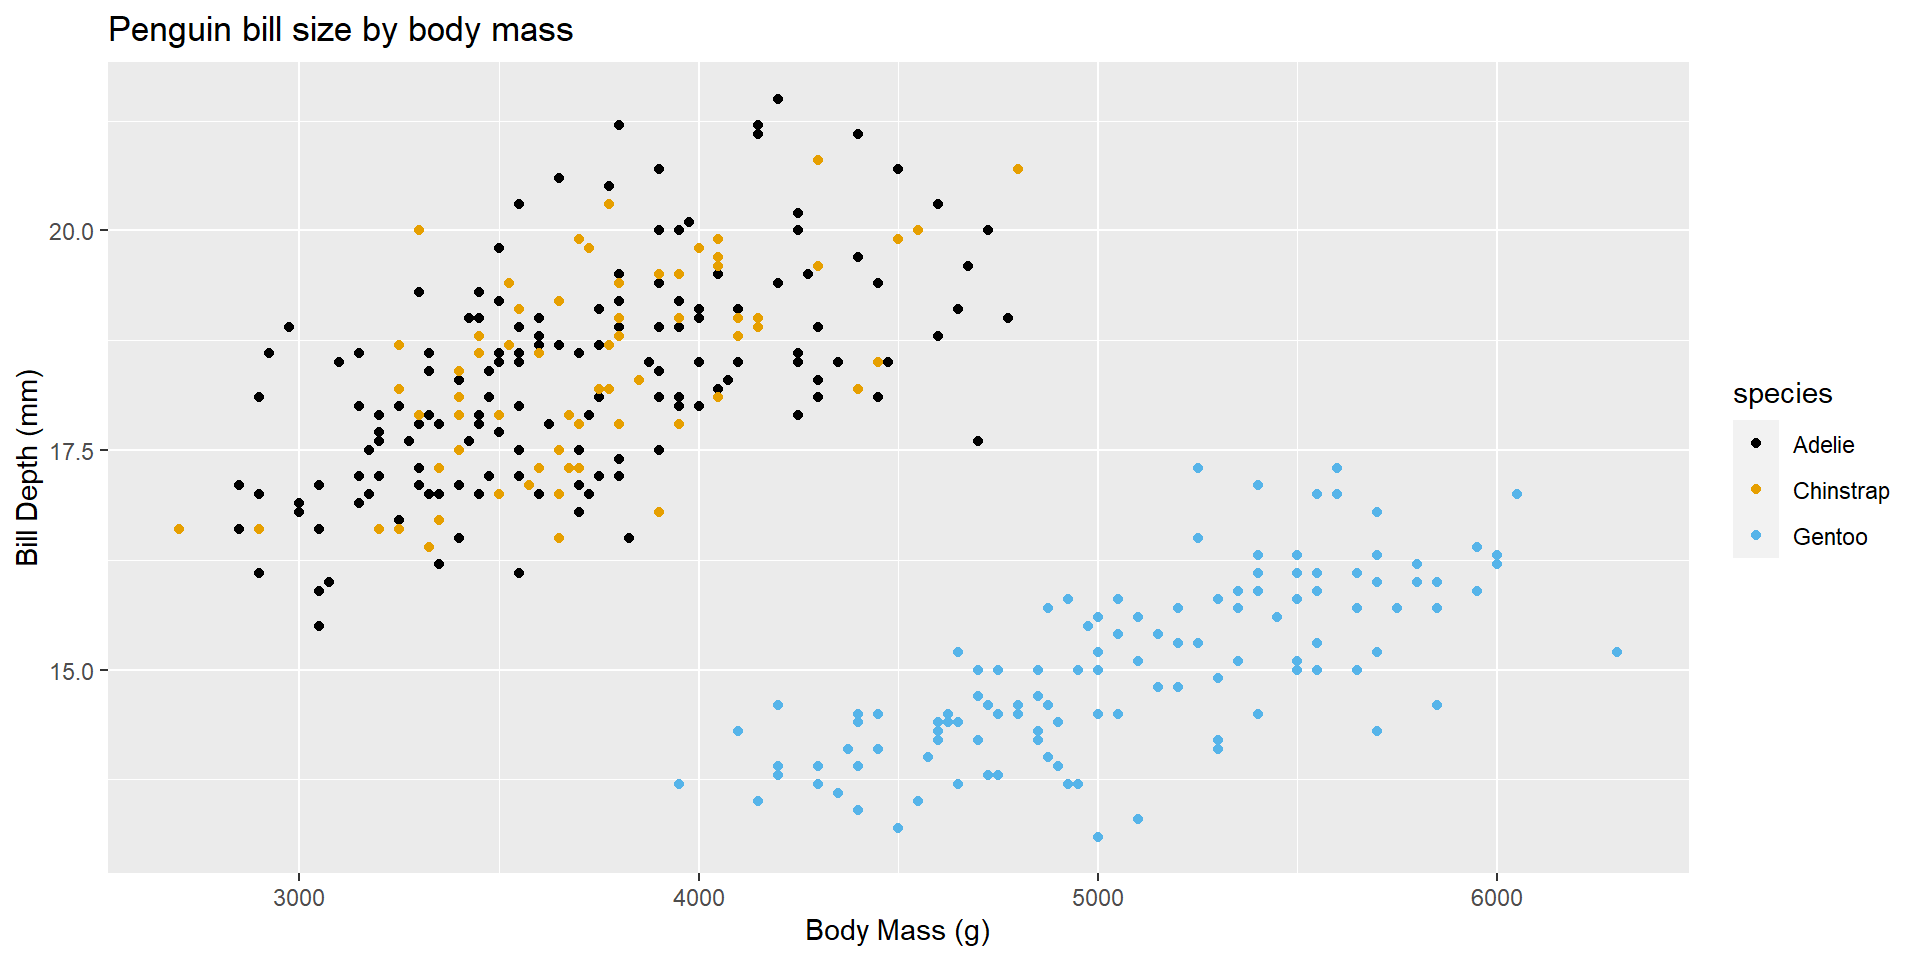
Scales: Being deliberate with color
library(ggthemes)ggplot(penguins,aes(body_mass_g,bill_depth_mm,color=species))+geom_point() +labs(x="Body Mass (g)",y="Bill Depth (mm)",title="Penguin bill size by body mass") +scale_color_colorblind()