#install.packages("palmerpenguins","tidyverse")
library(palmerpenguins)
library(tidyverse)

#Plot bill depth by species and sex
myPlot<-ggplot(data=penguins,aes(x=species,y=bill_depth_mm,color=sex))+
    geom_jitter(width=0.2) +
  scale_color_manual(values=c("Orange","Green"))+
    labs(x="Species",y="Bill Depth (mm)",color="Sex")

myPlotEnvironmental Data Analysis and Visualization
Warm-up activity
Create a file system for this week and open the script on Canvas
Fix the errors in the code so it works
Modify the colors/symbols to better express the data (remember to check your cheatsheet!)
Warm-up activity

Warm-up activity

Sensor of the week
Traffic sensors

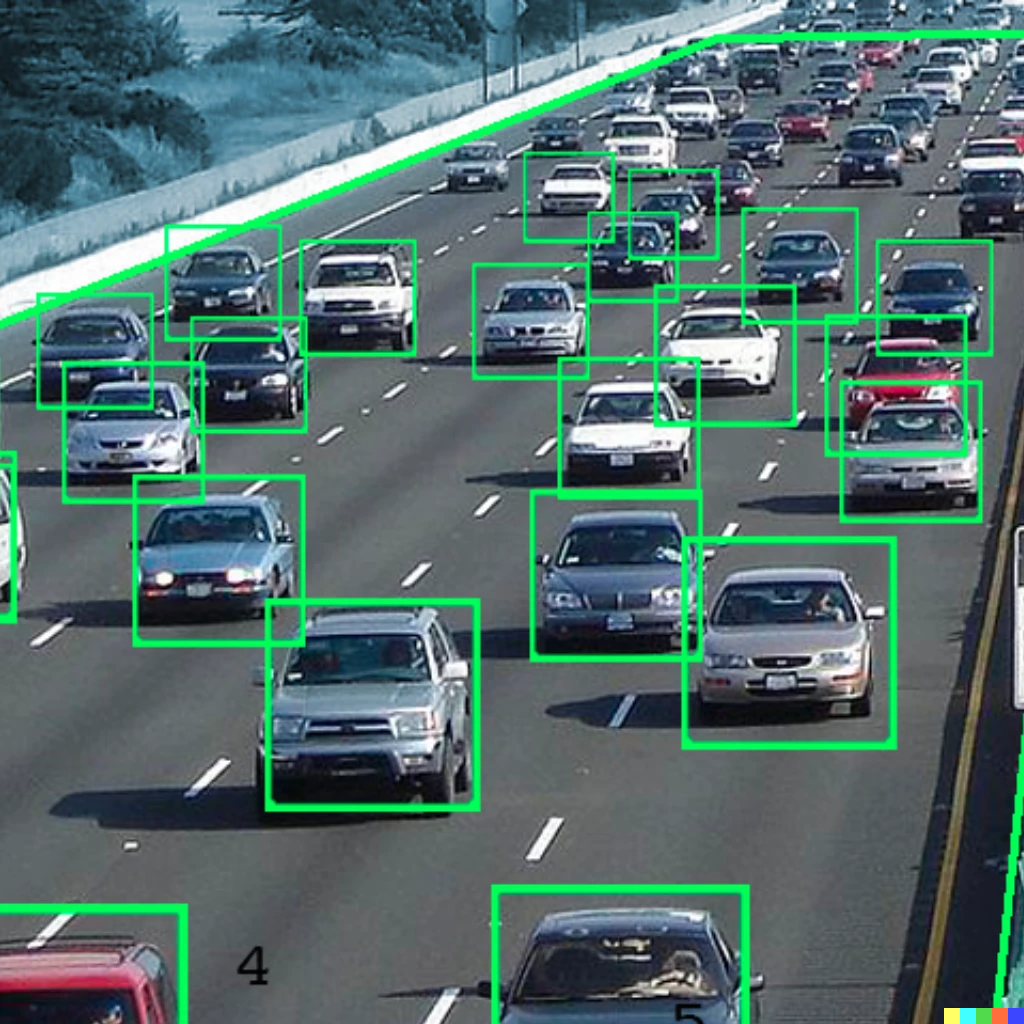
Sensor of the week
Traffic sensors
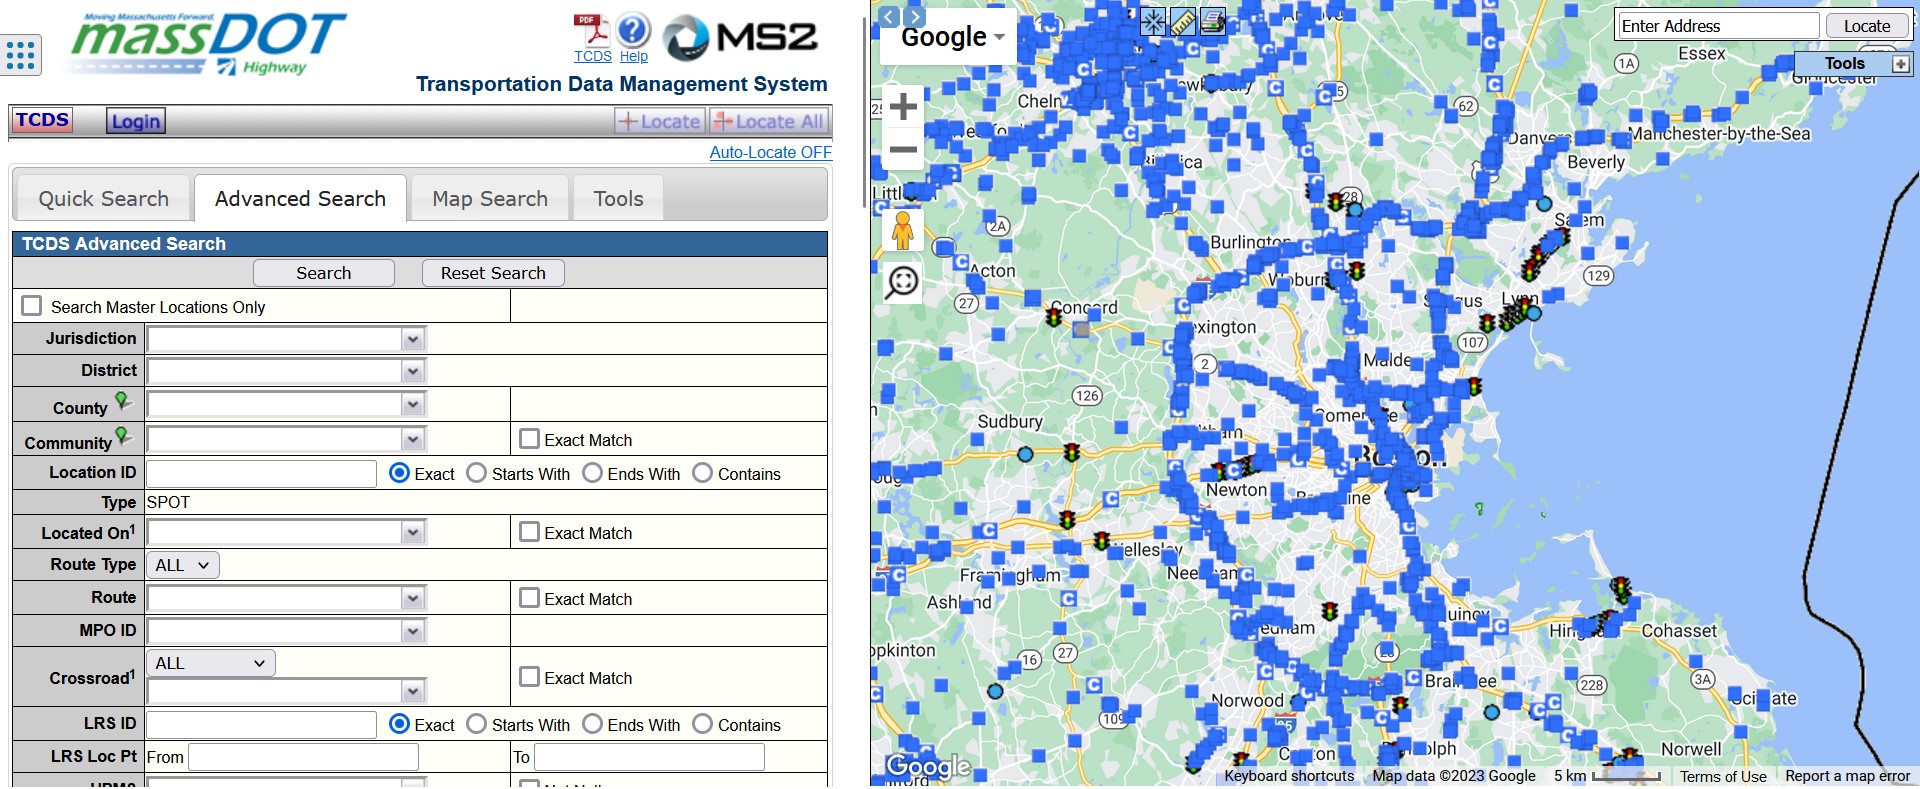
Data collection and data re-use
Data is usually collected with a particular goal in mind
Answering a research question (e.g., “What is the effect of animal cuteness on conservation priorities?”)
Establishing baselines (e.g., employment and wage census of workers in the hospitality industry )
Meeting reporting requirements (e.g., EPA chemical storage and release reporting)
Data collection and data re-use
When we re-use publicly available data, we do not have control over collection protocols, so our initial assessment will require us be critical about
whether data exists that can help us to answer our question
what the quality of that data is
whether the data shows patterning
Exploratory Data Analysis
Exploratory data analysis (EDA) is an approach to evaluating data prior to formal modeling or hypothesis testing.
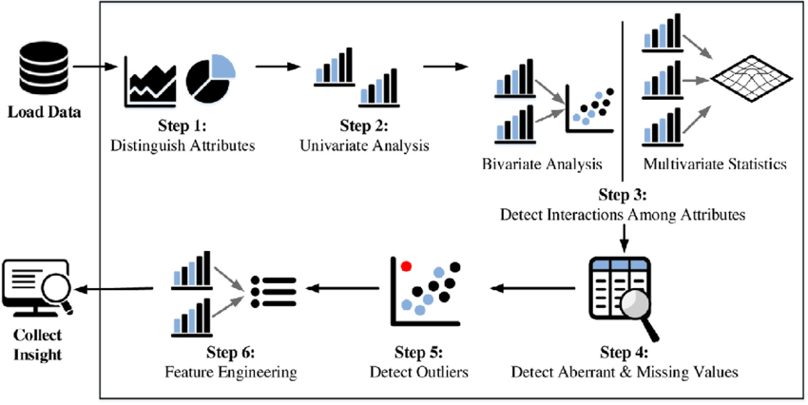
Describing Data
Nominal: no meaningful distance or order.
Ordinal: meaningful order but not distance.
Interval: meaning distance but no true zero.
Ratio: meaningful distance with true zero.
Nominal data
Data have no meaningful distance or order.

Ordinal data
Data have meaningful order but no meaningful distance.

Interval data
Data have meaningful distance but no true zero
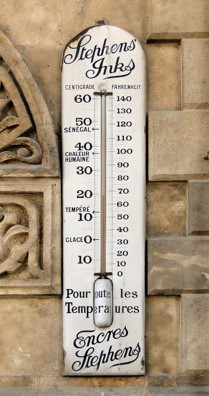
Ratio data
Data have meaningful distance and true zero.
Exploring variables
Univariate: Looking at one variable/column at a time
Bar chart – discrete
ggplot() + geom_bar()Histograms – continuous
ggplot() + geom_histogram()Boxplot - continuous
ggplot() + geom_boxplot()
Distributions
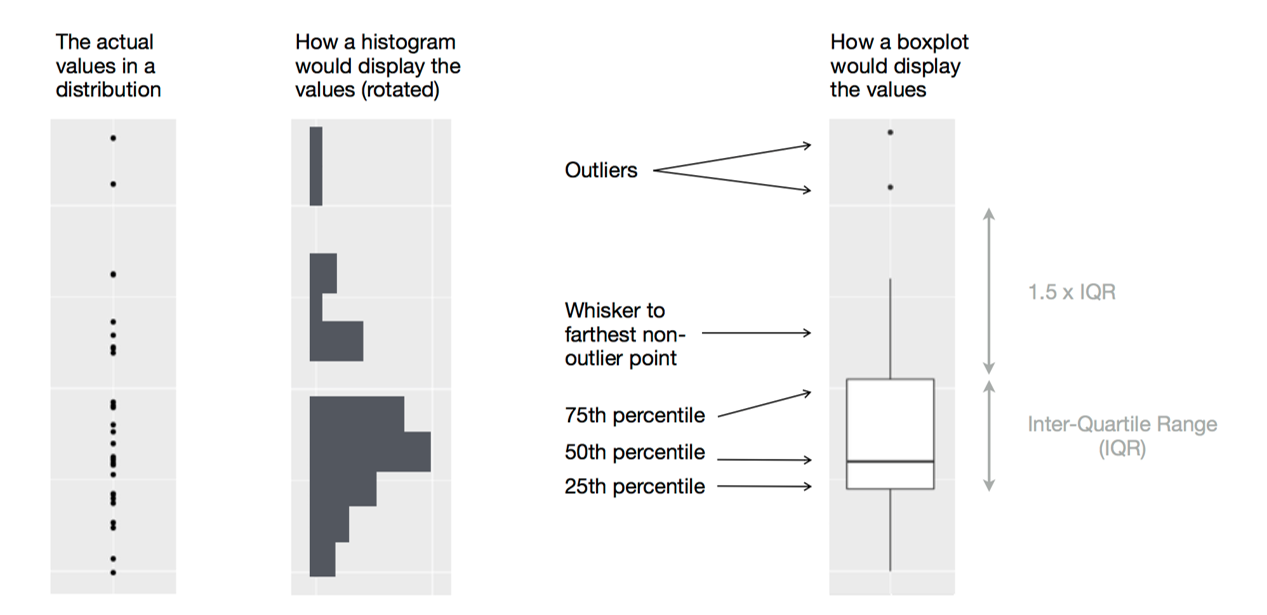
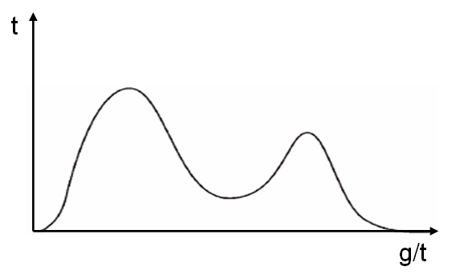
Interpreting a distribution
Measures of Center
Mean: Average value of all data
mean()Median: Central value of all data
median()
Interpreting a distribution
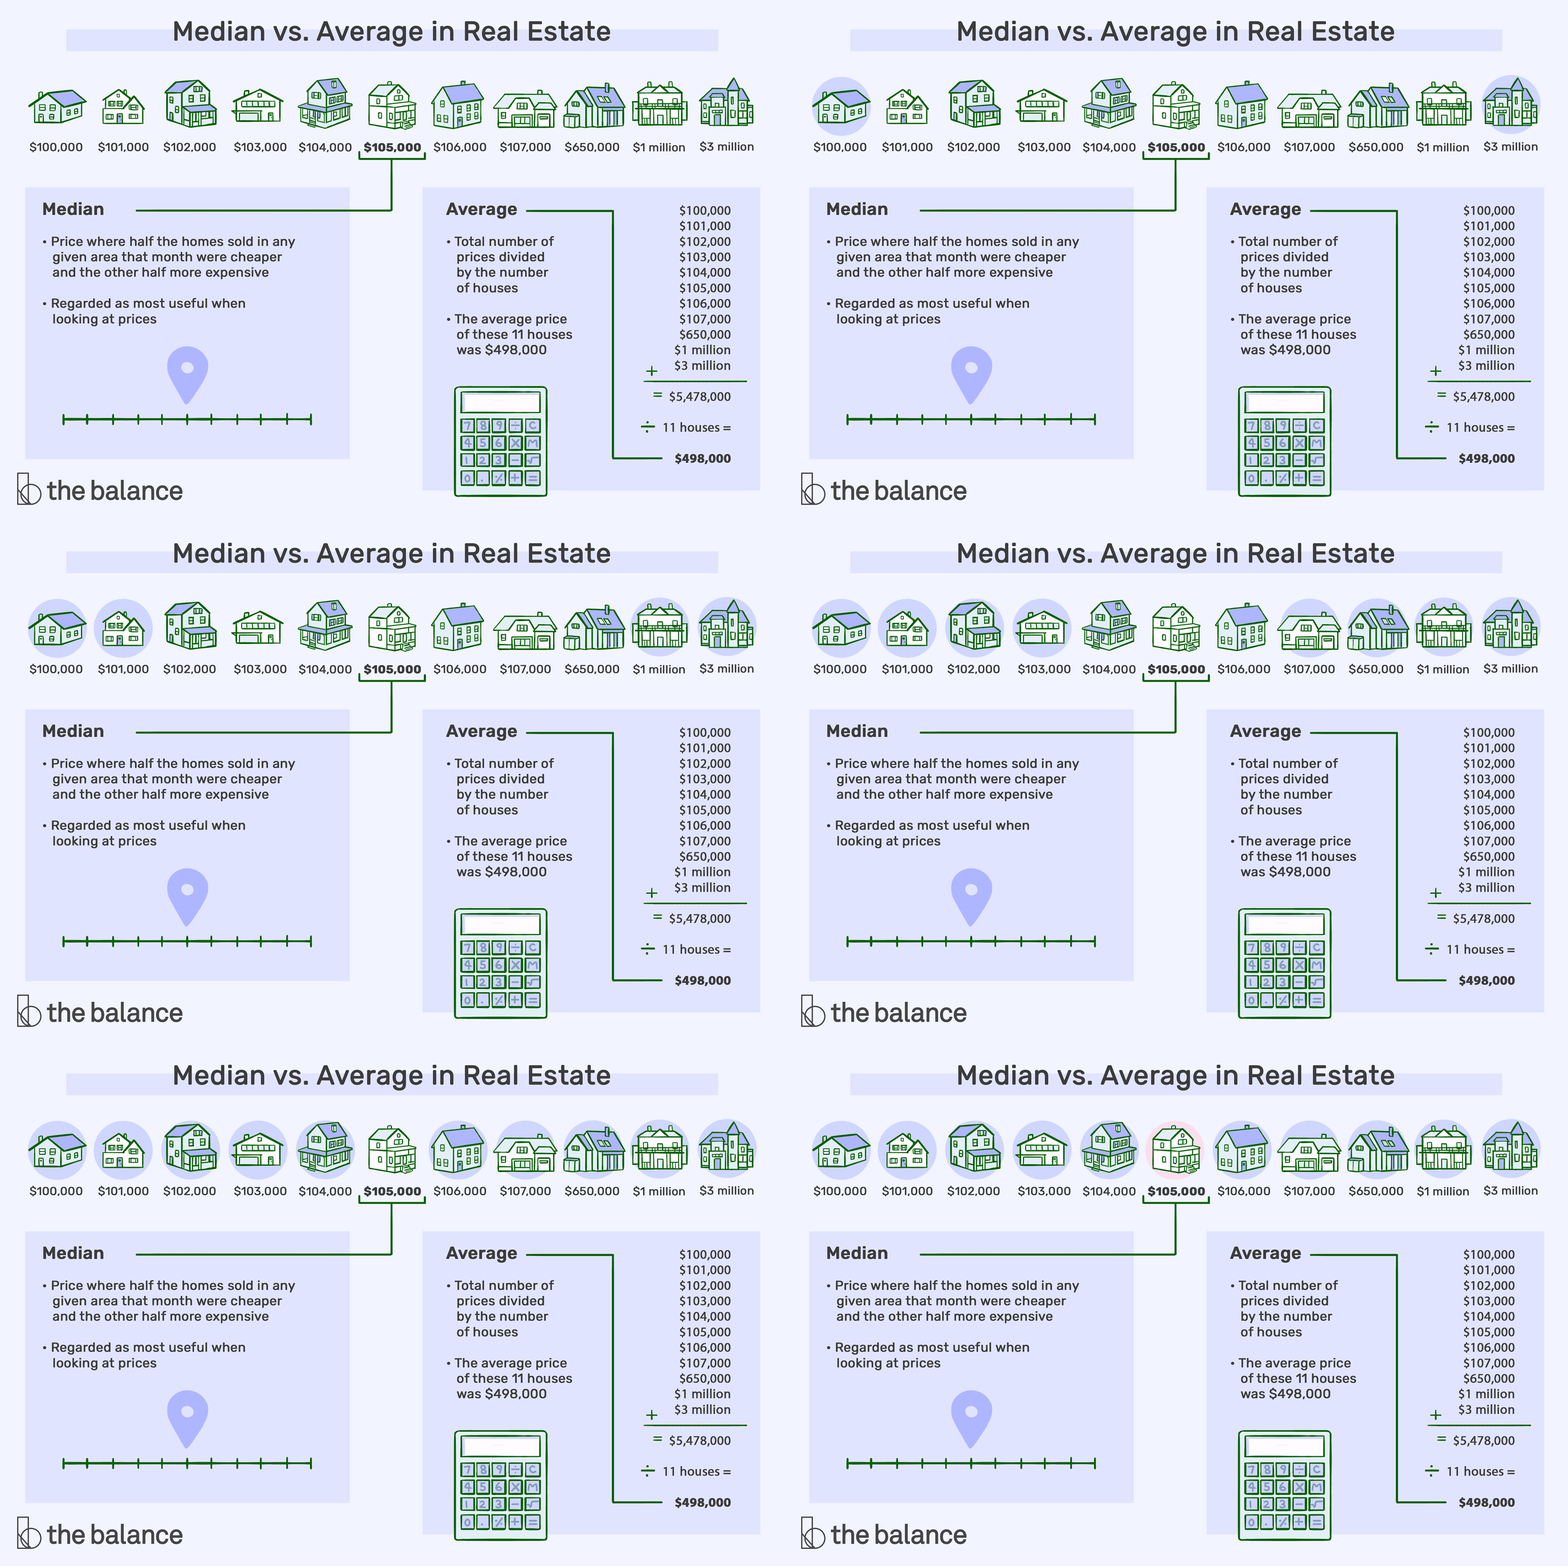
Interpreting a distribution
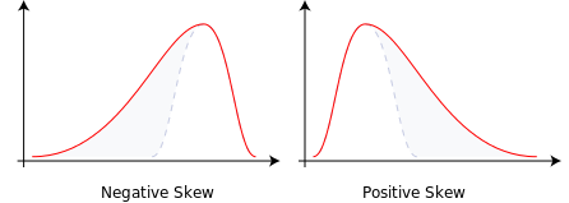
Range: Difference between largest and smallest values
Standard deviation: Distance from mean

Interpreting a distribution
Exploring interactions between variables
Multivariate : Looking at relationship between two or more variables
Scatter plots
ggplot() + geom_point()Bar chart
ggplot() + geom_bar()Line plots
ggplot() + geom_line()Heatmaps
ggplot() + geom_tile()
Exploring interactions between variables

Activity: Explore some data!
Download and open the abalone.csv data file from Canvas
Evaluate the length, diameter, weight.whole, and rings variables
How are each of these distributed?
Do they show any relationships?