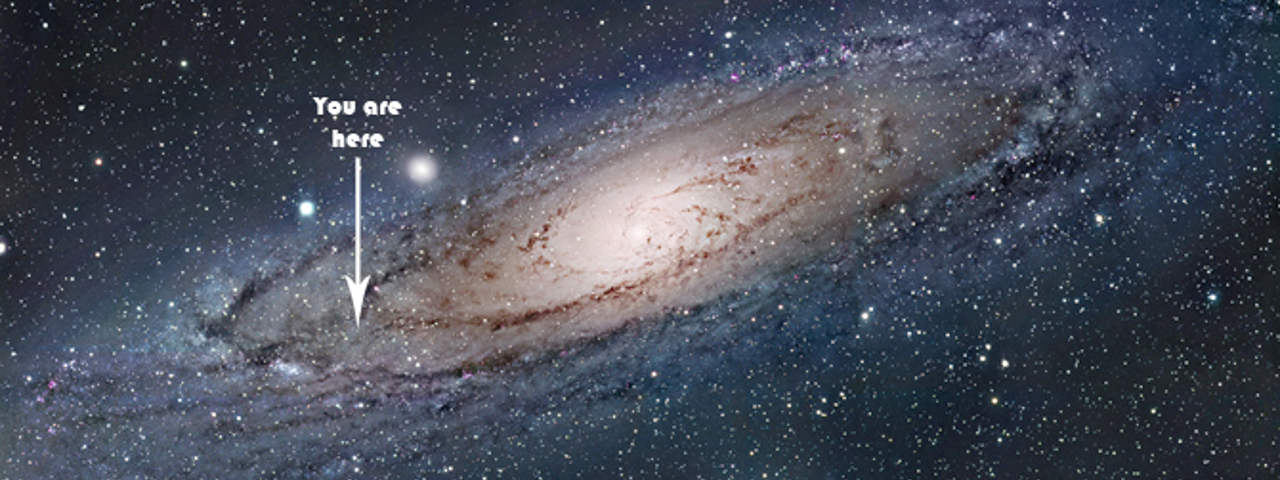
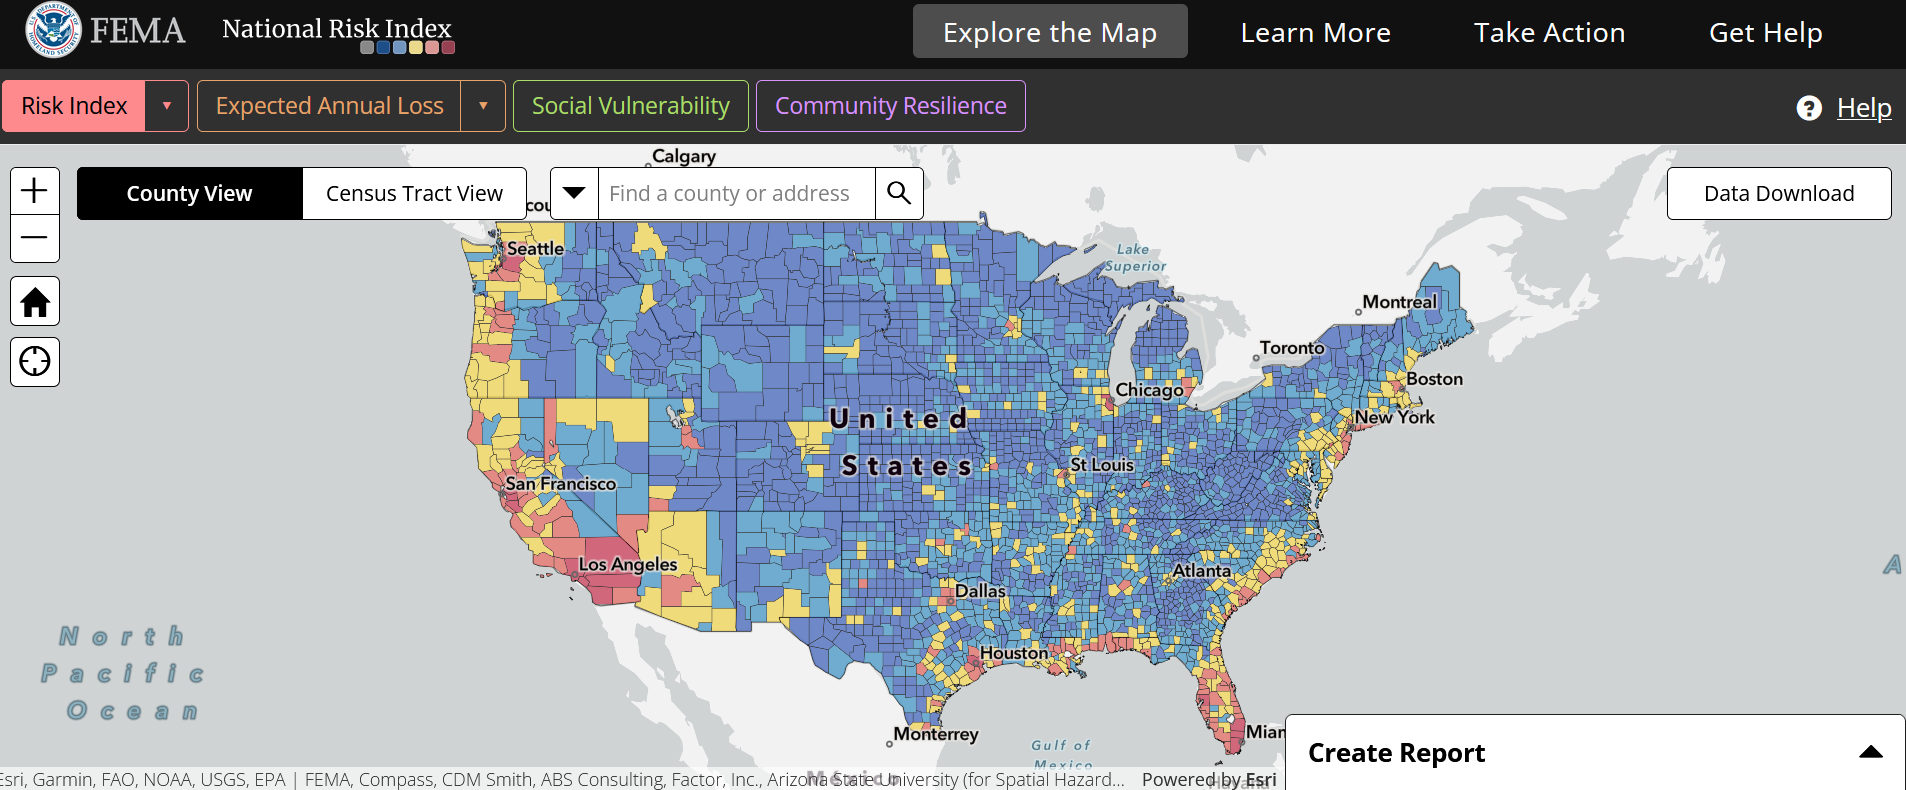
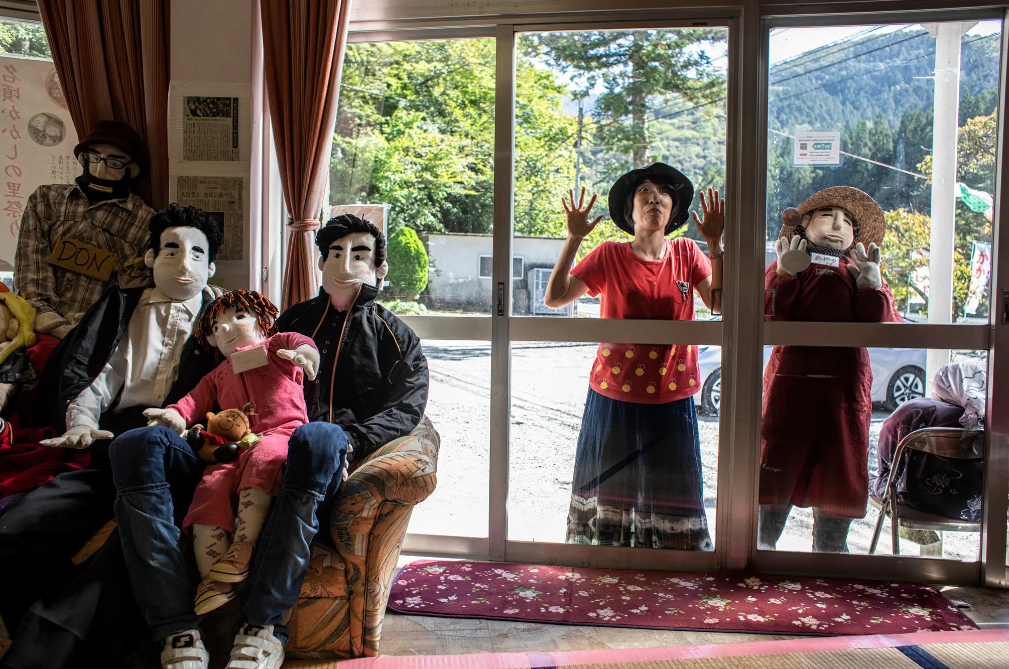
For this exercise, I’ll ask you to avert your eyes prior to the slide being shown.
When the slide is shown, pay attention to where on the image your eyes are drawn first, then second, then third, and so on. They may return to the same place more than once.
What do you see?
https://fineartamerica.com
What do you see?
NY Times
What do you see?
https://itravel81.wordpress.com
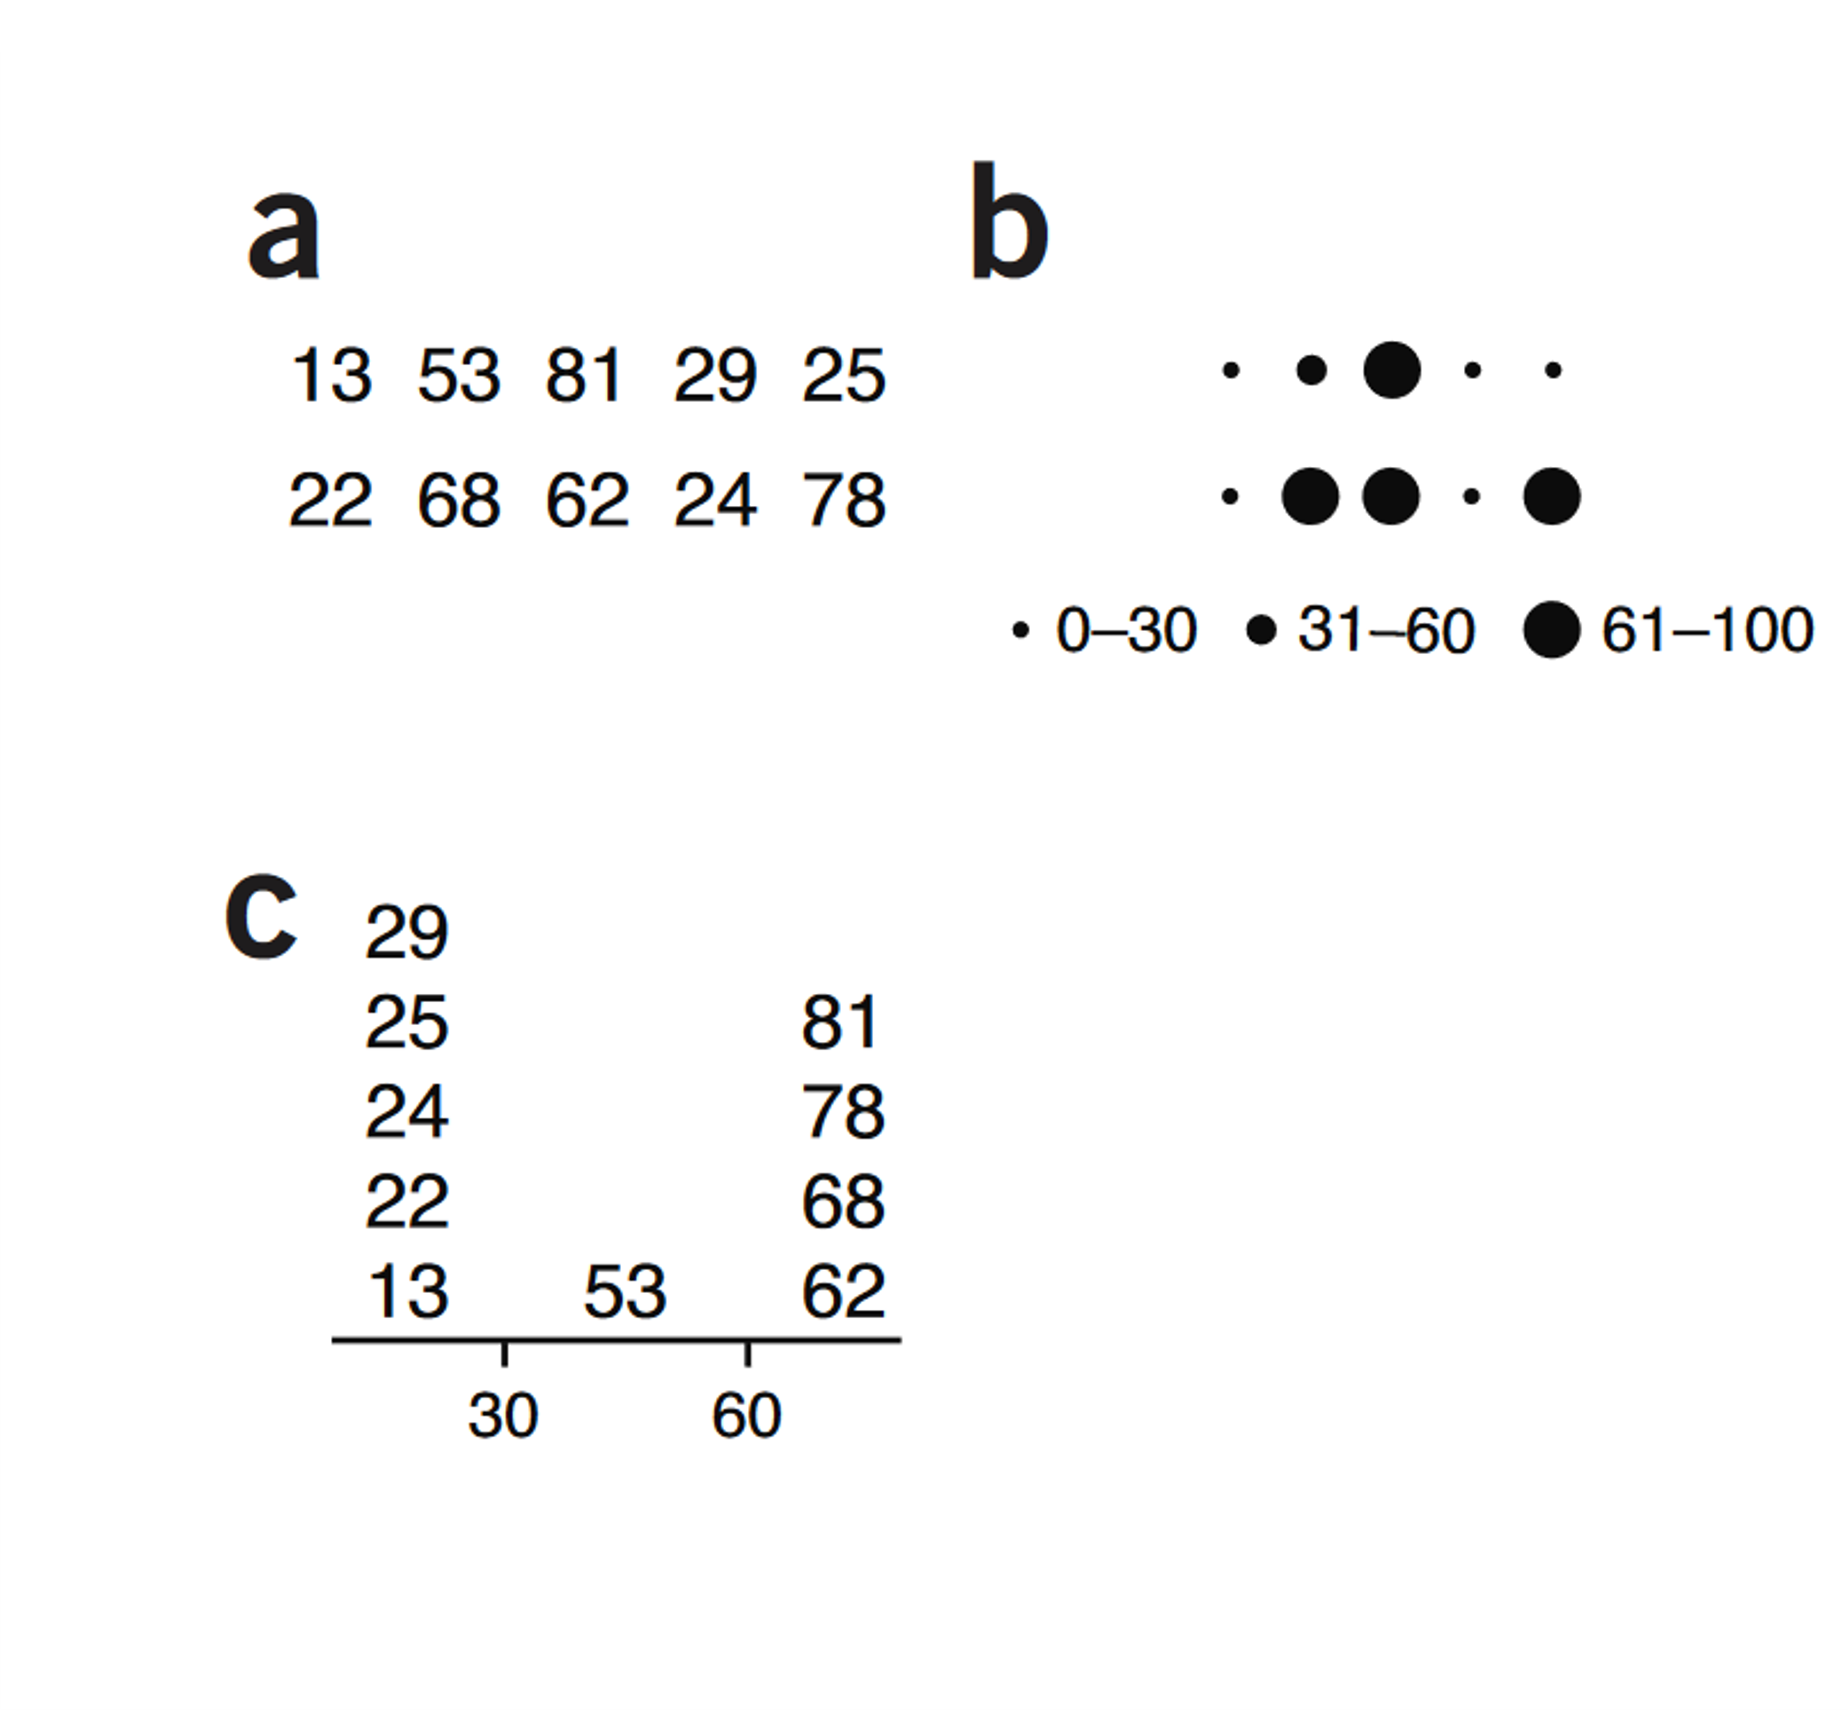
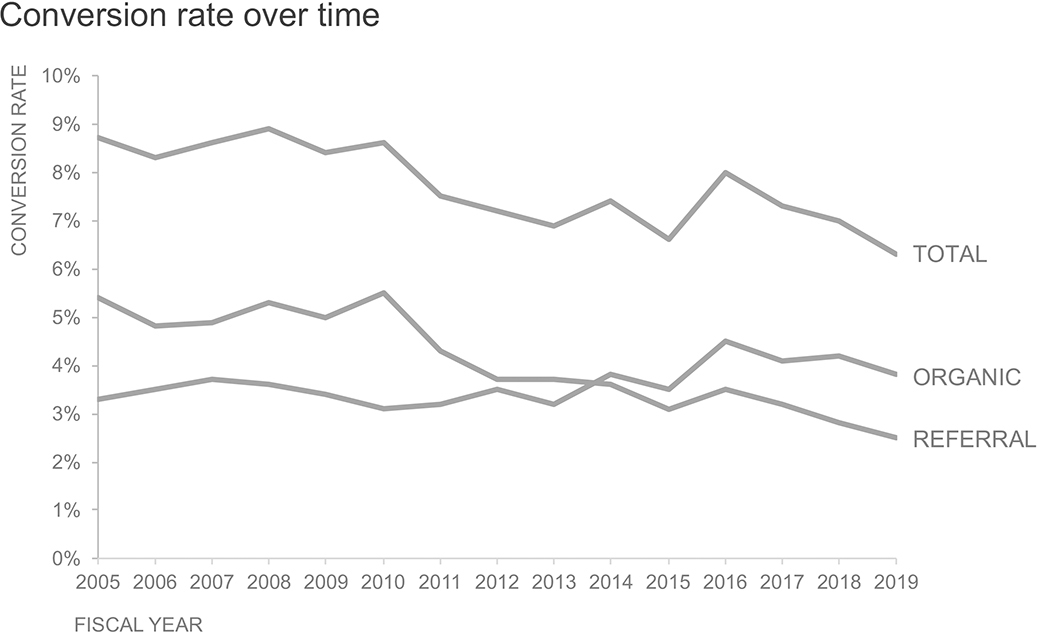
Drawing the eye to the headline
Knaflic, Cole Nussbaumer. 2019. Storytelling with Data. New York: Wiley.
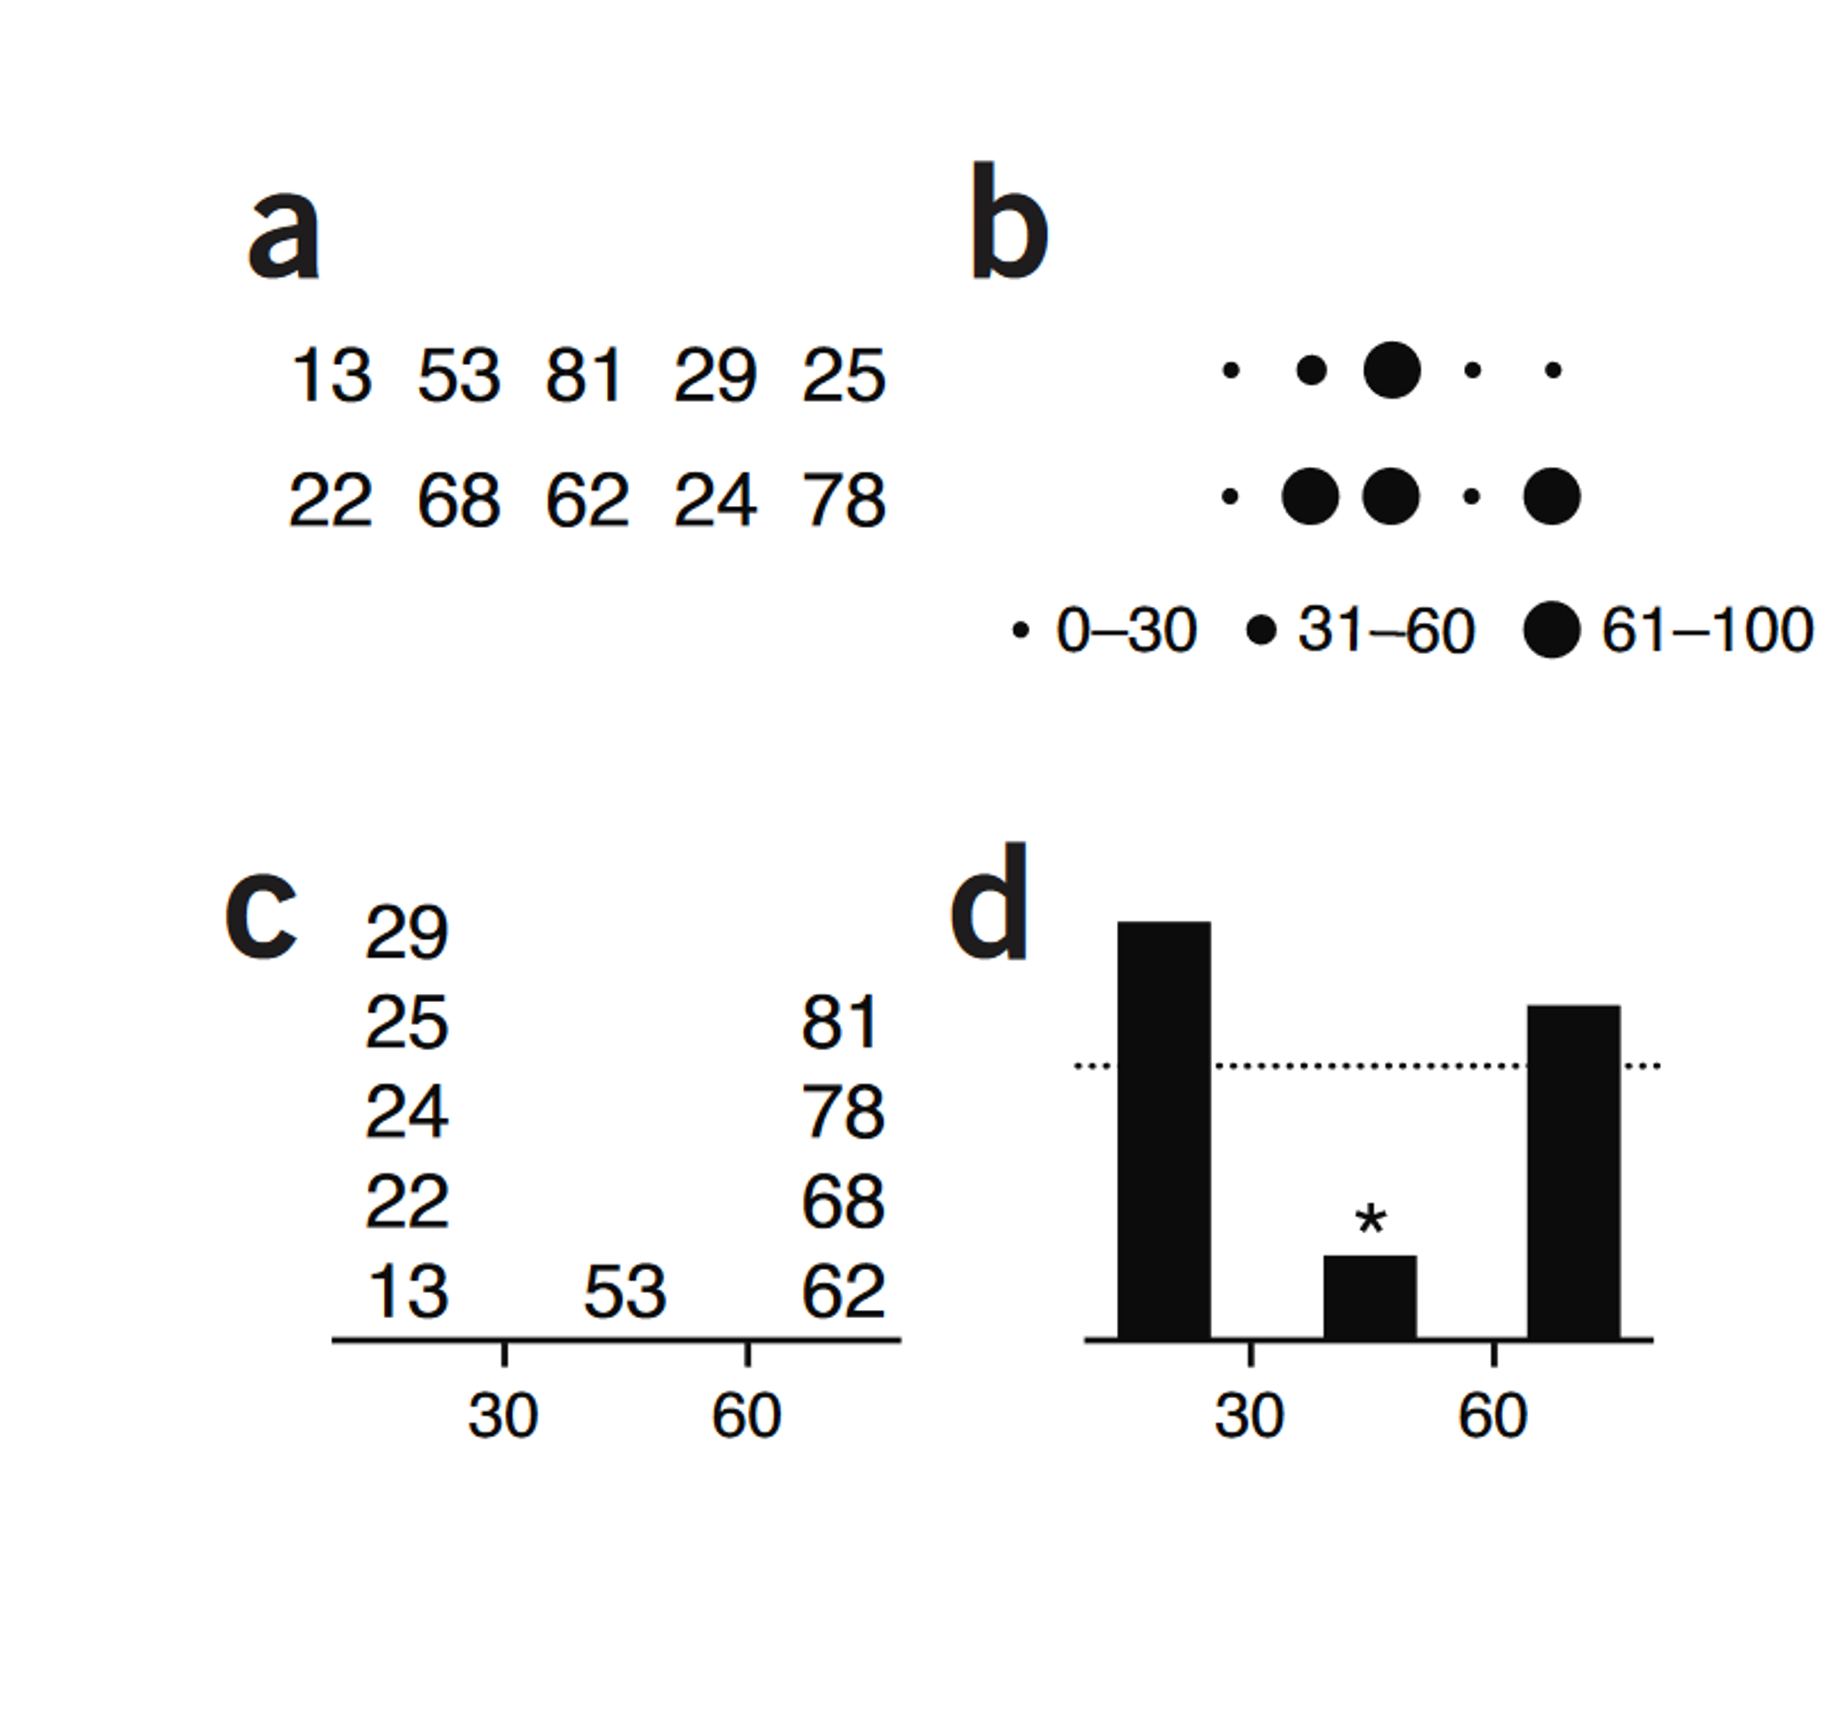
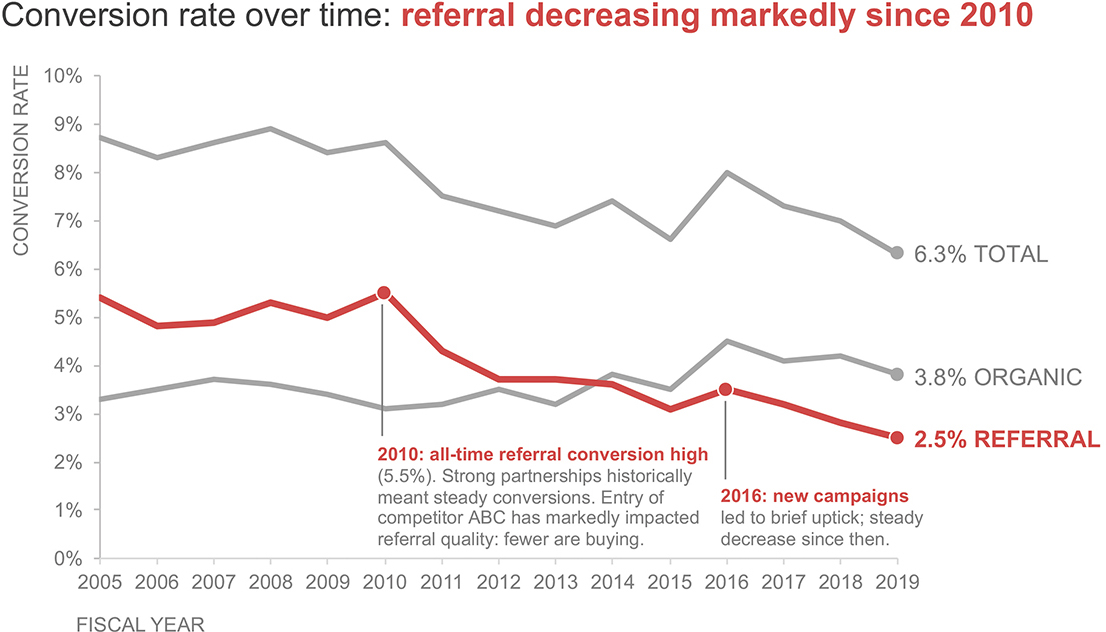
Drawing the eye to the headline
Knaflic, Cole Nussbaumer. 2019. Storytelling with Data. New York: Wiley.
The simple features or sf package gives R functions for handling vector data and interfacing it with the tidyverse.
library(tidyverse)library(sf)
The sf package
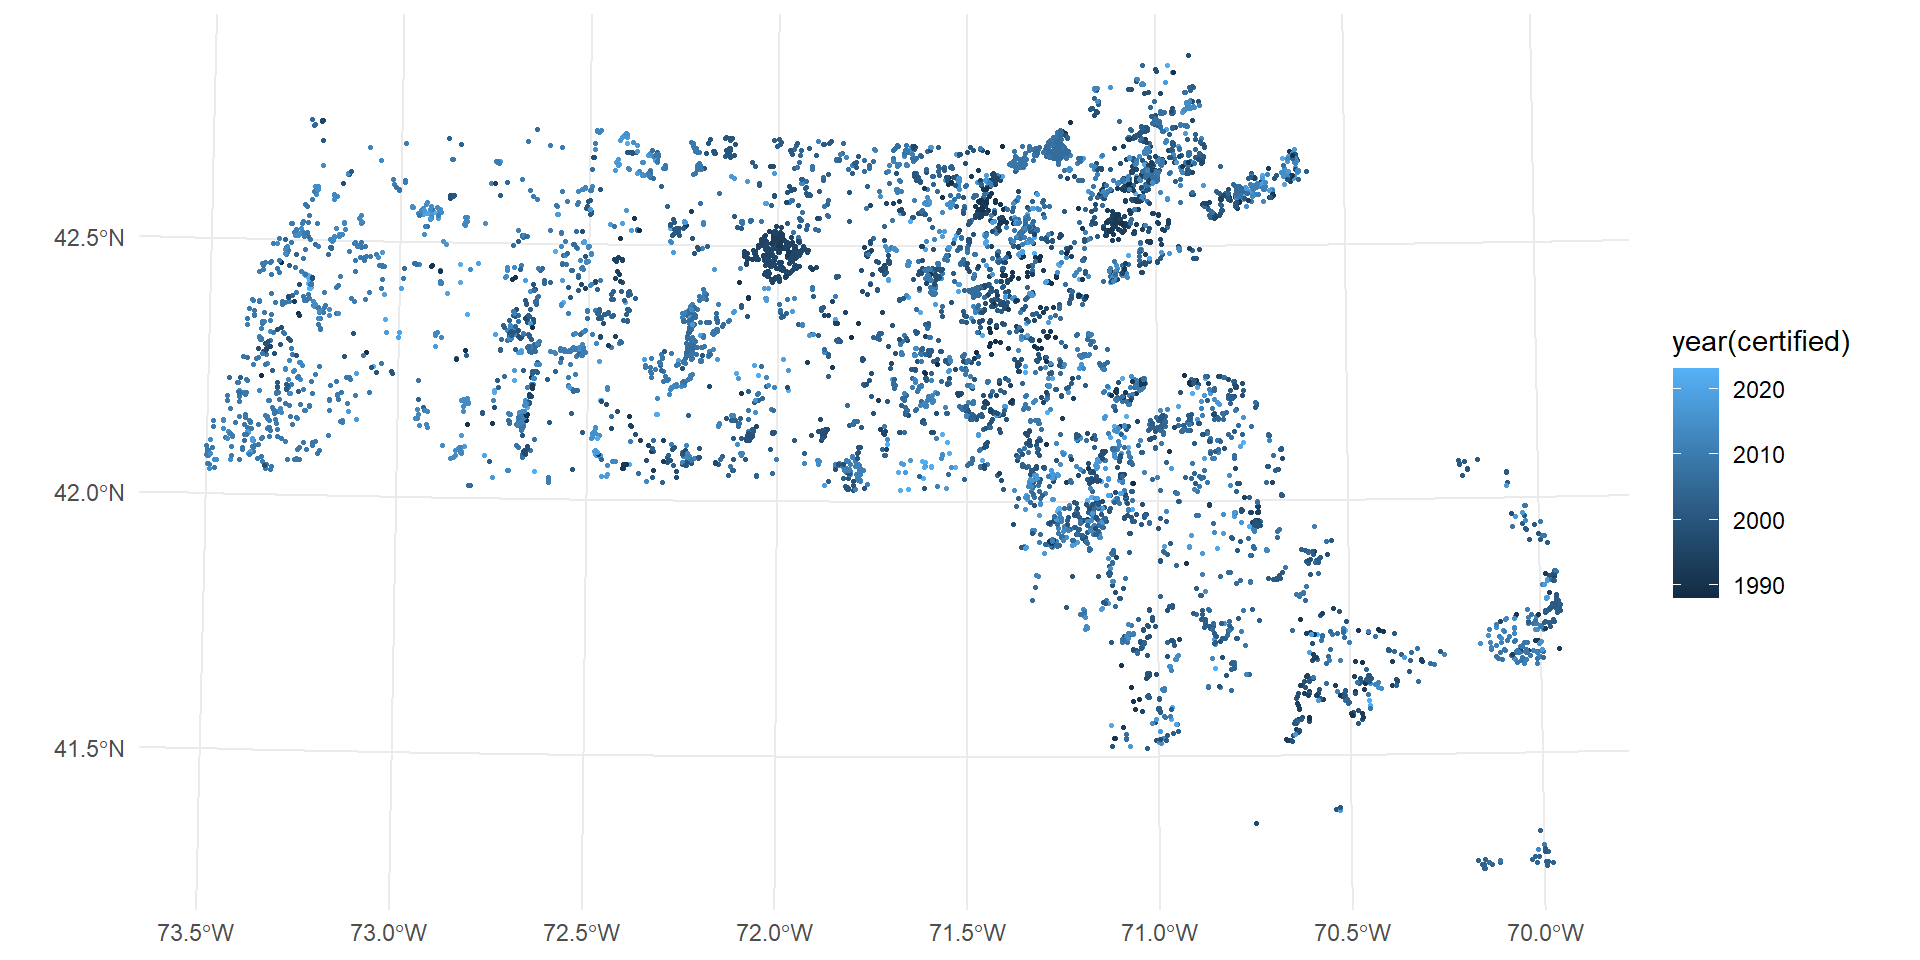
vernalPools<-st_read("data/GISDATA_CVP_PTPOINT.shp",quiet=TRUE)vernalPools<-st_zm(vernalPools,drop =TRUE, what ="ZM")vernalPools
Simple feature collection with 7881 features and 3 fields
Geometry type: POINT
Dimension:     XY
Bounding box:  xmin: 34452.43 ymin: 781370.8 xmax: 329087.3 ymax: 958316.4
Projected CRS: NAD83 / Massachusetts Mainland
First 10 features:
   cvp_num                       criteria  certified                  geometry
1     5098 Obligate Species, Fairy Shrimp 2009-05-31 POINT (101876.8 878024.9)
2     4385               Obligate Species 2007-01-08 POINT (124514.6 895968.7)
3     7707               Obligate Species 2016-12-29 POINT (253914.4 830115.9)
4     7627               Obligate Species 2015-08-06 POINT (119130.7 877295.4)
5     1826               Obligate Species 1999-07-15 POINT (188430.5 937917.1)
6     4622               Obligate Species 2007-10-17   POINT (213979.5 863452)
7     6711               Obligate Species 2012-06-11 POINT (271080.4 935932.4)
8     1306               Obligate Species 1997-09-18   POINT (103664 872042.3)
9     6997               Obligate Species 2013-02-27 POINT (238222.5 927072.7)
10    3441               Obligate Species 2004-06-17 POINT (199376.9 865967.6)


