# A tibble: 1 × 6
  Timestamp           Name     Rating closeFriday Longitude Latitude
  <chr>               <chr>     <dbl> <time>          <dbl>    <dbl>
1 26/10/2023 15:34:10 Semolina 4 22:00 -71.1 42.4Environmental Data Analysis and Visualization
Warm-up exercise
Go to Canvas and click on the Where Should I Eat? link
Follow the instructions and provide information about restaurants in the Boston area (you don’t have to like them to include them)
Enter at least 2-3 restaurants into the form
Visualization Critique

https://eagereyes.org/blog/2008/linear-vs-quadratic-change
Visualization Critique

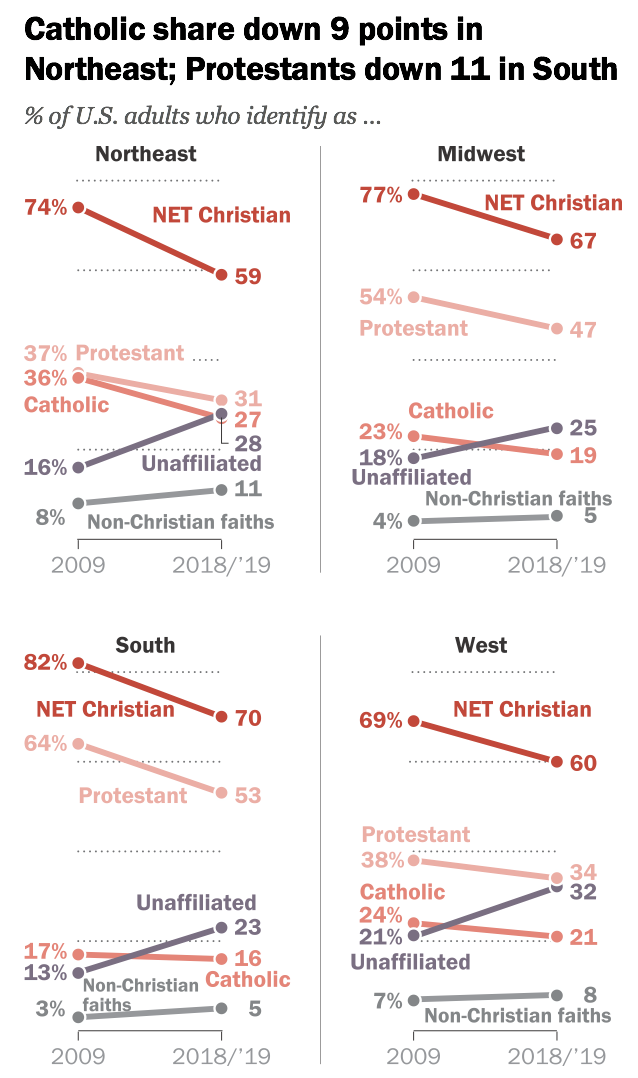
Pew Research
Visualization Critique

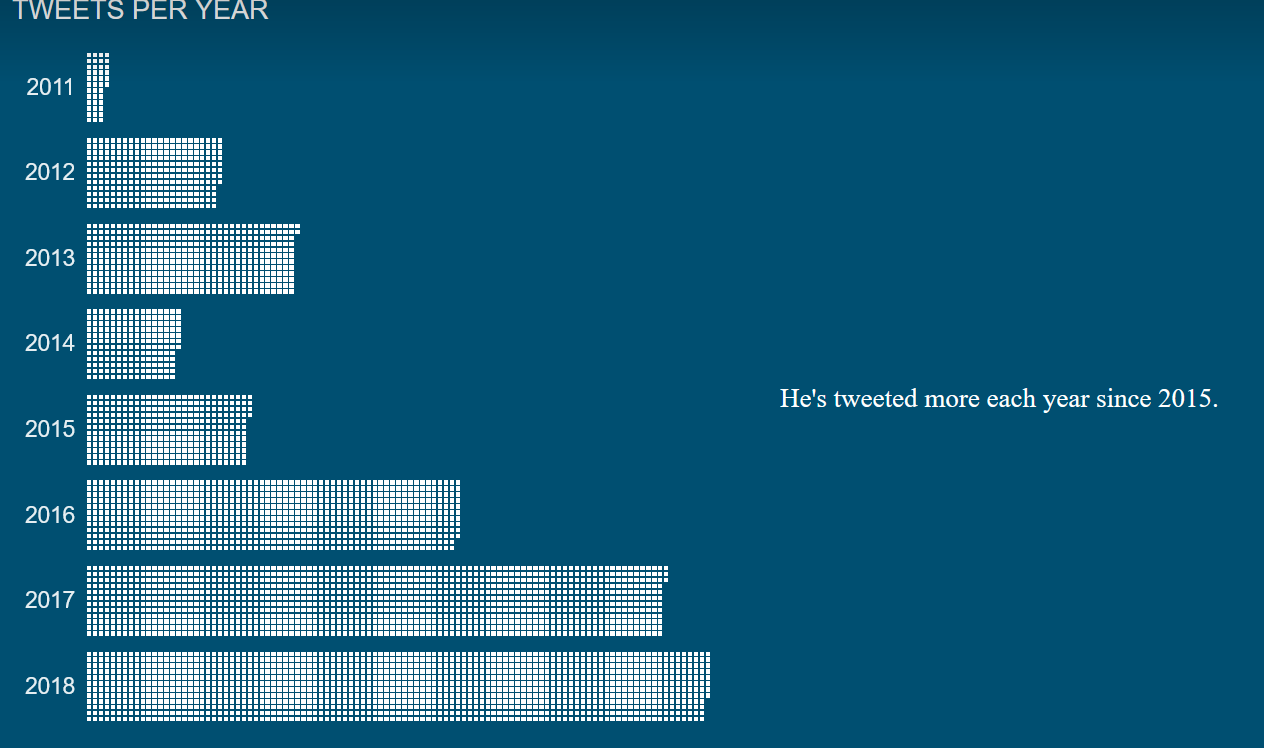
WaPo
Activity: Where Should I Eat?
Download the whereEat.csv file on Canvas and convert to
Activity: Where Should I Eat?
Storytelling

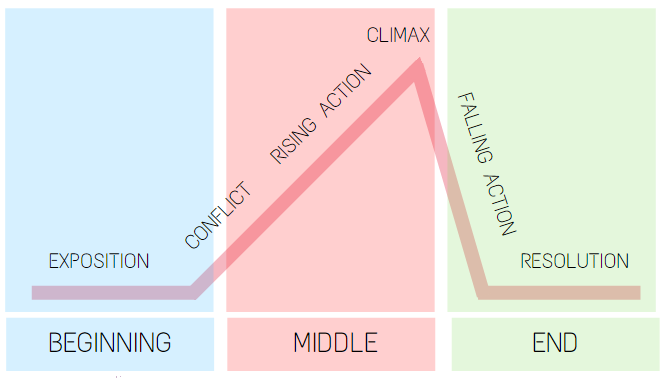
juicyenglish.com
Activity: A Story in Three Images
Working together in pairs, go the Canvas assignment and choose a story from a list. Your task is to convey the main idea to us in three images without using images directly from that story.
Use the internet to find (tasteful, appropriate) images to tell your story. Add these to the Canvas response.
In each image, think carefully about how
Beginning, middle, and end
The setup, rise, apex, resolution
The mood of the story
Base Maps

IMDB
Next week
Data Science in Space! Part 2
Raster data and the
terrapackageMaking maps that