Warning: package 'terra' was built under R version 4.4.2Warning: package 'tidyterra' was built under R version 4.4.2Warning: package 'terra' was built under R version 4.4.2Warning: package 'tidyterra' was built under R version 4.4.2For the most part, visualizing raster data follows the same rules as other continuous datasets. Here, we’ll use GEBCO data centered around Cebu City in the Phillippines.
cebuDEM<-rast("data/cebu_DEM.tif")Raster data behaves similarly to the 2D bin or heatmap objects we’ve seen before, the primary aesthetic attribute to be used here is fill color. Therefore, all of the scale_fill_* functions apply here. For example, scale_fill_gradient will plot between low and high values:
ggplot() +
  geom_spatraster(data=cebuDEM) +
  scale_fill_gradient(low="blue",high="red") +
  theme_minimal() +
  labs(fill="Elevation (m)")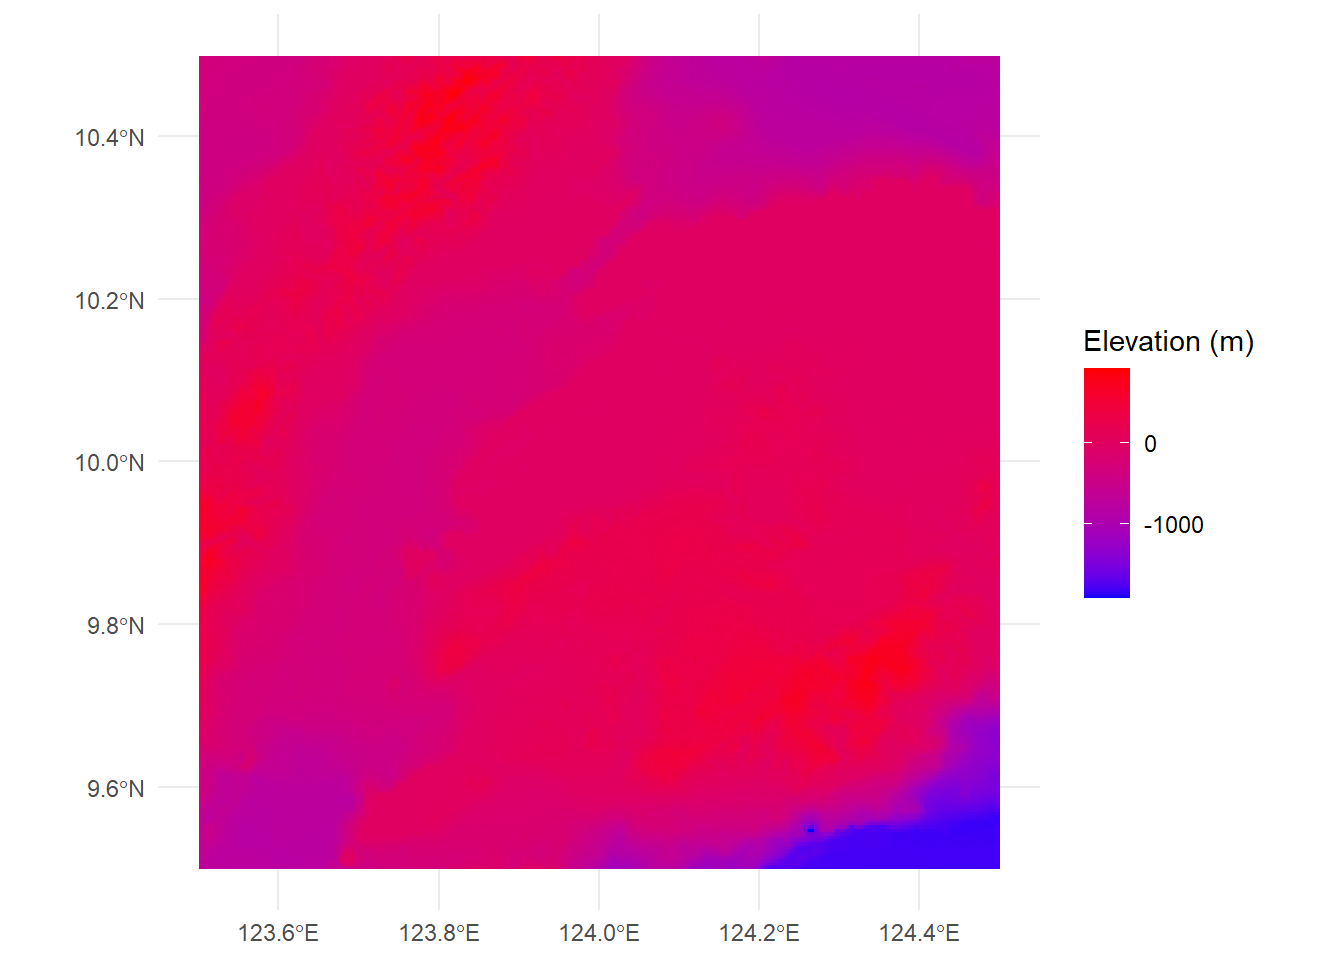
This isn’t particularly revealing. Alternatively, we can use scale_fill_gradient2 to use divergent colors, here using a midpoint of 0m to split the gradient at sea level:
ggplot() +
  geom_spatraster(data=cebuDEM) +
scale_fill_gradient2(low="red",mid="yellow",high="darkgreen",midpoint=0)  +
  theme_minimal() +
  labs(fill="Elevation (m)")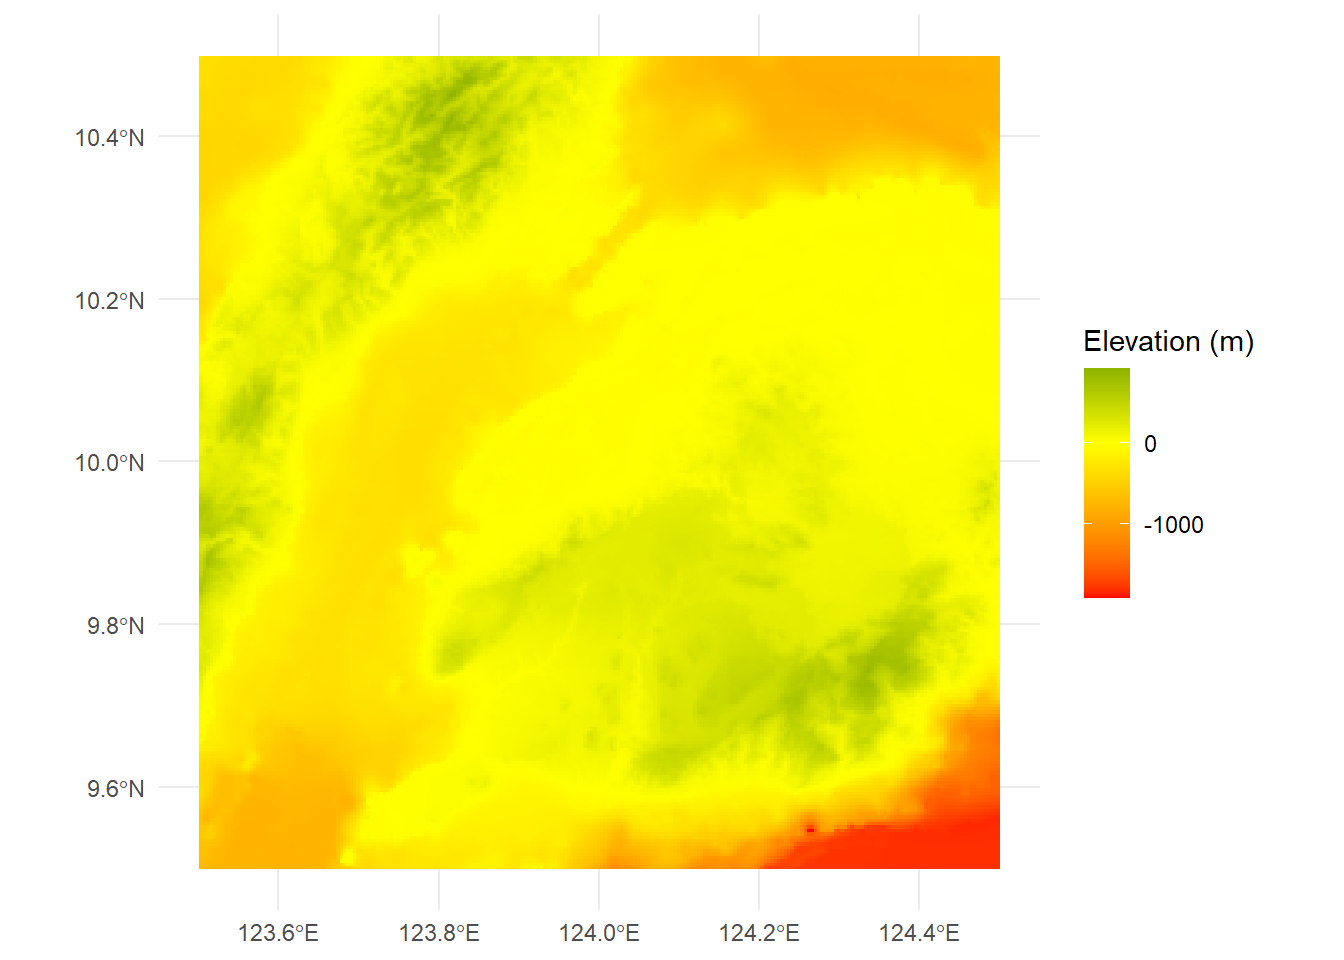
That’s a little clearer. Other palettes work here as well. Here’s a how it looks with viridis, using the magma palette:
ggplot() +
  geom_spatraster(data=cebuDEM) +
scale_fill_viridis_c(option="magma")  +
  theme_minimal() +
  labs(fill="Elevation (m)")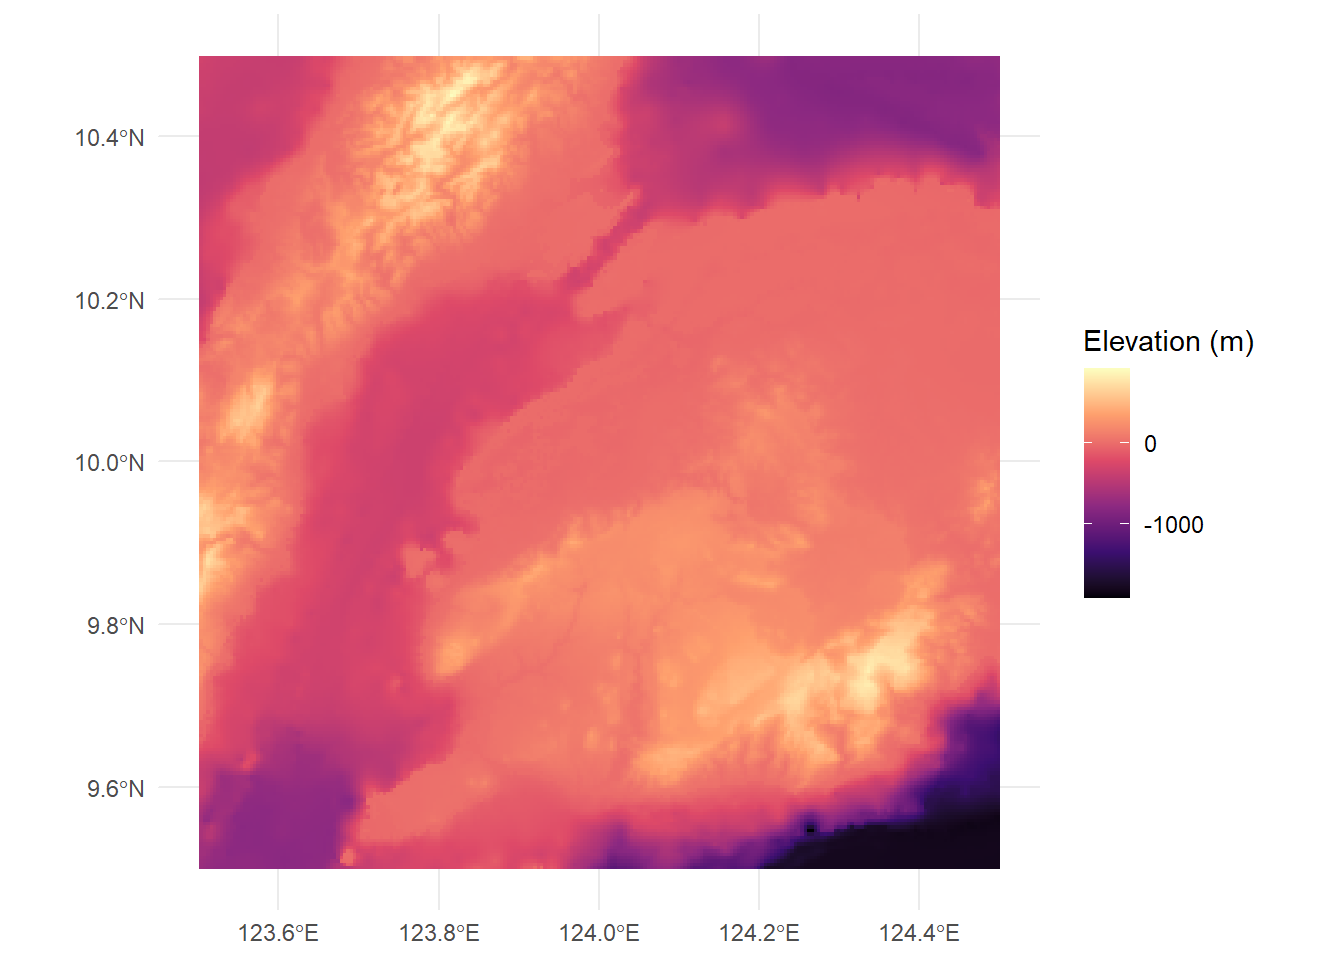
By the way, if we want to generate a summary statistic about the cell values in our raster, we can access these using the values function:
max(values(cebuDEM))[1] 925min(values(cebuDEM))[1] -1932This can be useful for setting
elevations<-values(cebuDEM)
ggplot(data=elevations,aes(cebu_DEM))+
  geom_histogram()
`stat_bin()` using `bins = 30`. Pick better value with `binwidth`.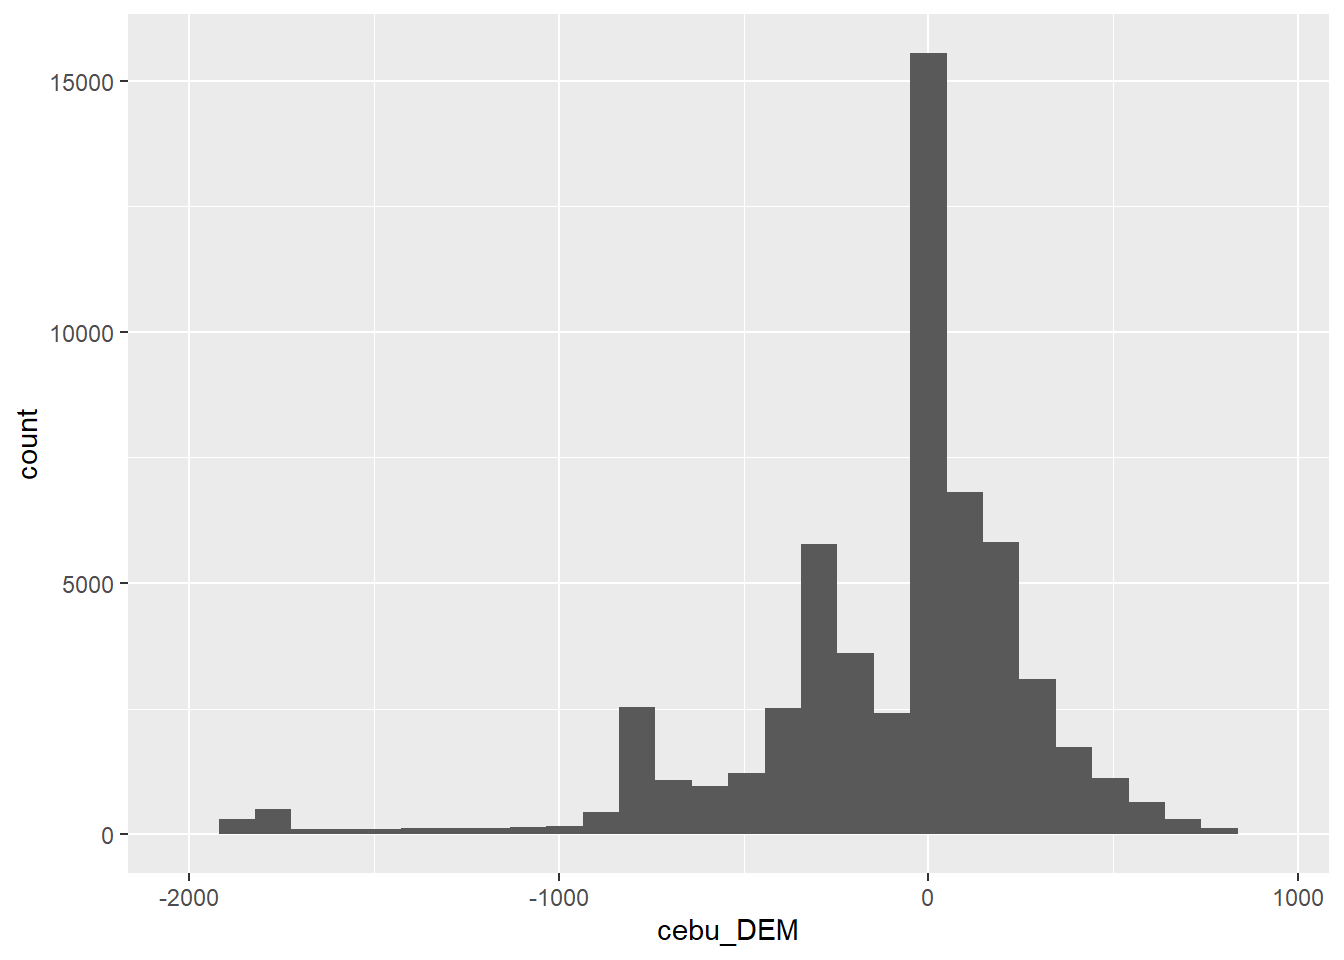
With elevation or other continuous data, we may want to apply colors that correspond to particular intervals. One way to do this us using the rescale from the scales package:
library(scales)
Attaching package: 'scales'The following object is masked from 'package:terra':
rescaleThe following object is masked from 'package:purrr':
discardThe following object is masked from 'package:readr':
col_factormn<-min(values(cebuDEM))
mx<-max(values(cebuDEM))
rescaledElev<-rescale(c(mn,-1000,-500,0,500,mx),to=c(0,1))Here what we’ve done is first create variables storing the minimum and maximum values from the raster. Then we used rescale to create a vector of values between that minimum and maximum, but scaled between 0 and 1. We can use these to control the look of the plot plot with scale_fill_gradientn:
ggplot() +
  geom_spatraster(data=cebuDEM) +
scale_fill_gradientn(colors=c("darkblue","blue","skyblue","darkgreen","lightgreen"),values=rescaledElev)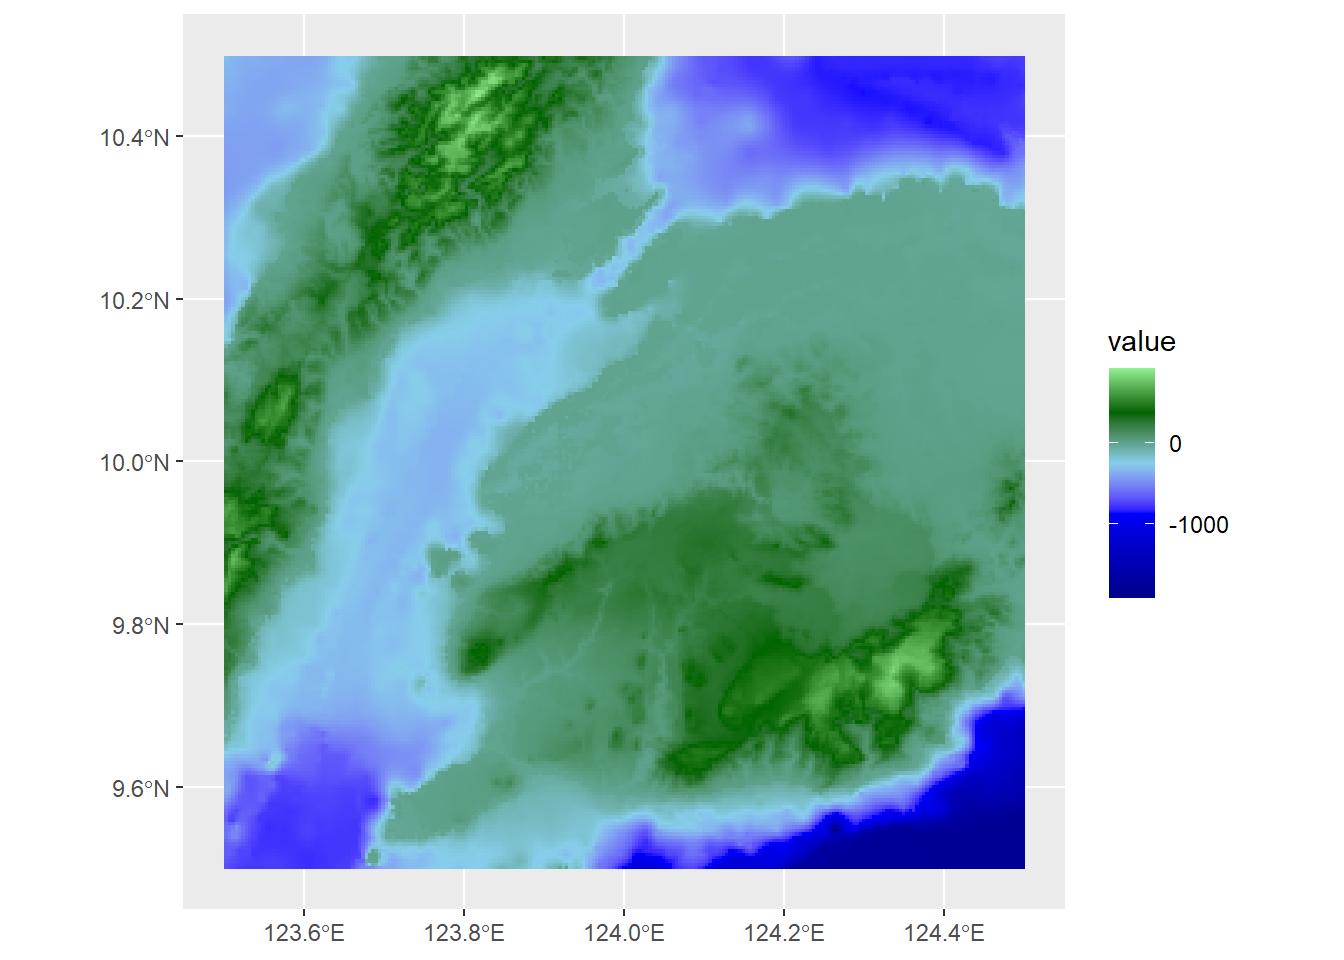
This looks OK, but since maps often have distinct color boundaries between water and land, we might want to indicate those colors with blue. s, so we can set a hard boundary by adding two values after the minimum: -1 and 1
rescaledElev<-rescale(c(mn,-1000,-500,-1,0,1,500,mx),to=c(0,1))Now when we run the ggplot, we can add two new colors: dark blue and blue, so our values will scale up to blue shades only through to 361
ggplot() +
  geom_spatraster(data=cebuDEM) +
scale_fill_gradientn(colors=c("darkblue","blue","skyblue","darkgreen","lightgreen"),values=rescaledElev)+
  theme_minimal() +
  labs(fill="Elevation (m)")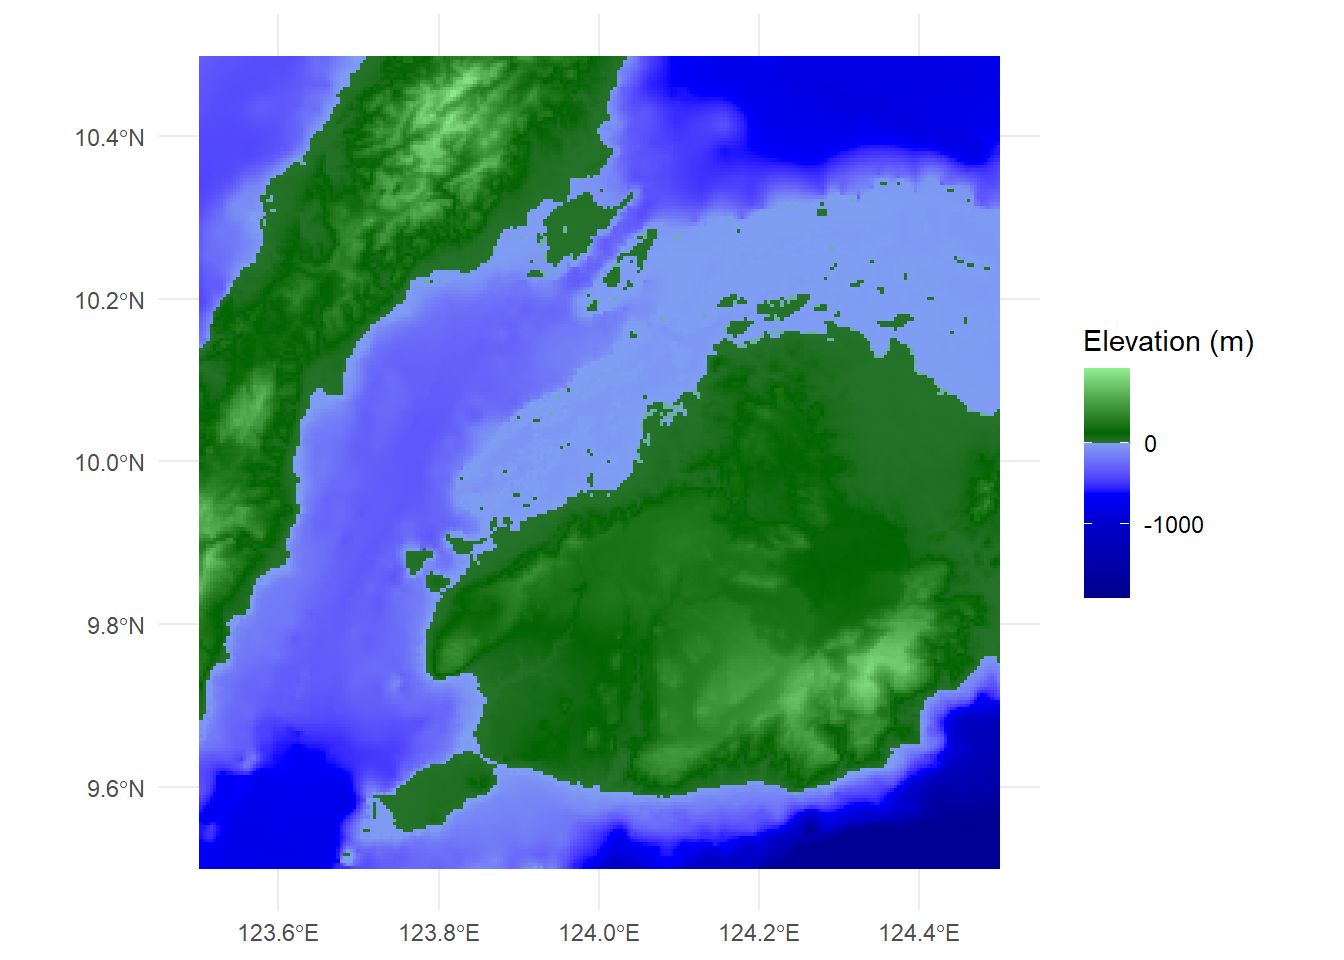
At this point, we could continue to modify the colors and rescaled intervals until we get the precise look we want, but it looks much more like a map of the terrain and waterways around Cebu City. The same principles work for multilayer rasters. For example, we can apply these individually:
ggplot() +
  geom_spatraster(data=turkanaRain$turkanaRain_4) +
scale_fill_distiller(palette = "RdBu",direction=1) +
  theme_minimal() +
  labs(fill="Precipitation \n(mm)")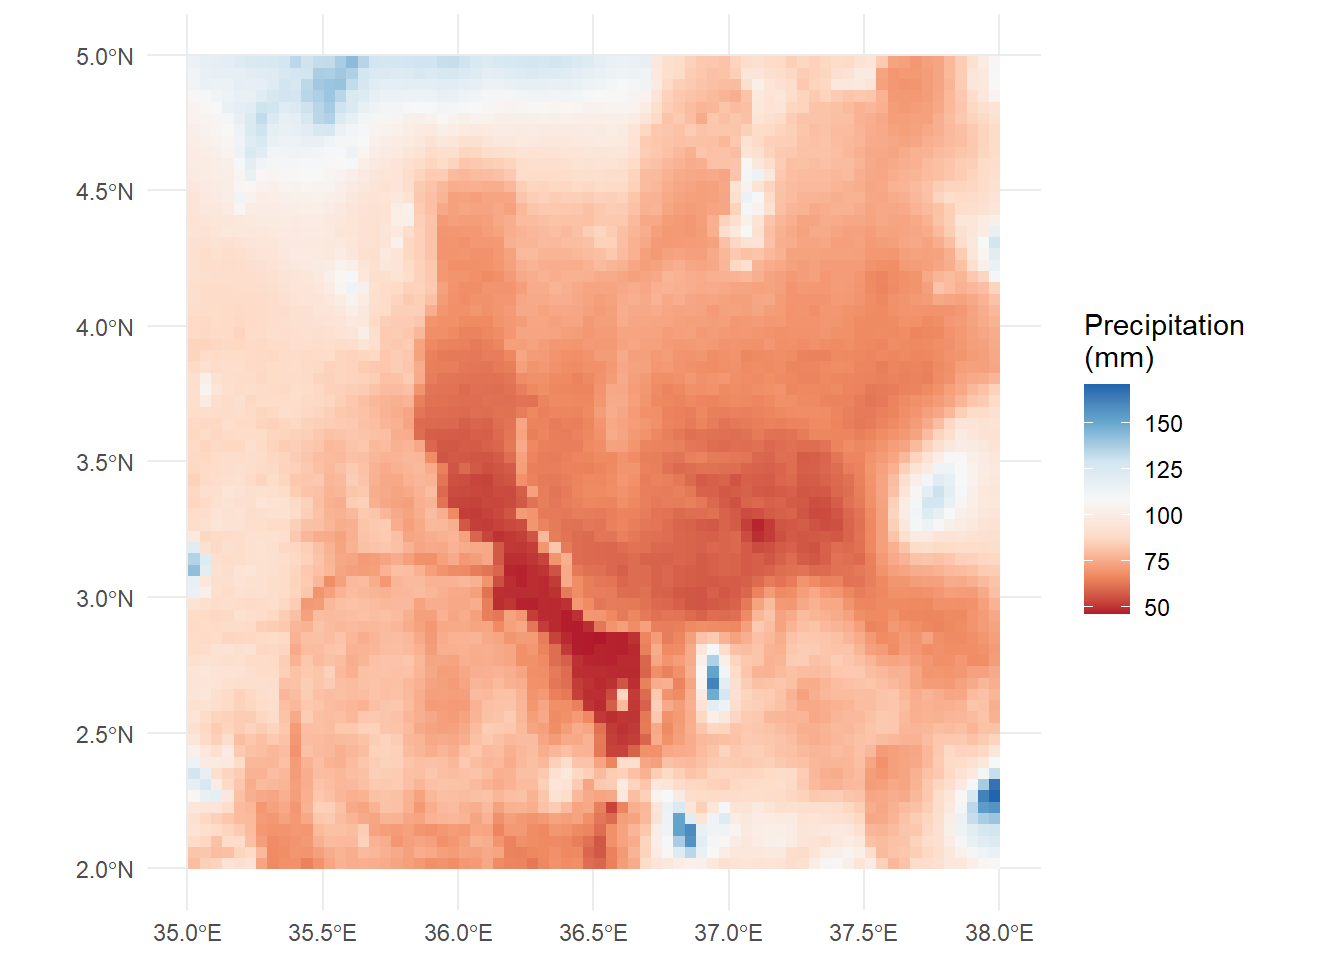
Or we can plot values across multiple rasters using facet_wrap:
ggplot() +
  geom_spatraster(data=turkanaRain4) +
  facet_wrap(~lyr) +
scale_fill_distiller(palette = "RdBu",direction=1,na.value="black")+
  theme_minimal() +
  labs(fill="Precipitation \n(mm)")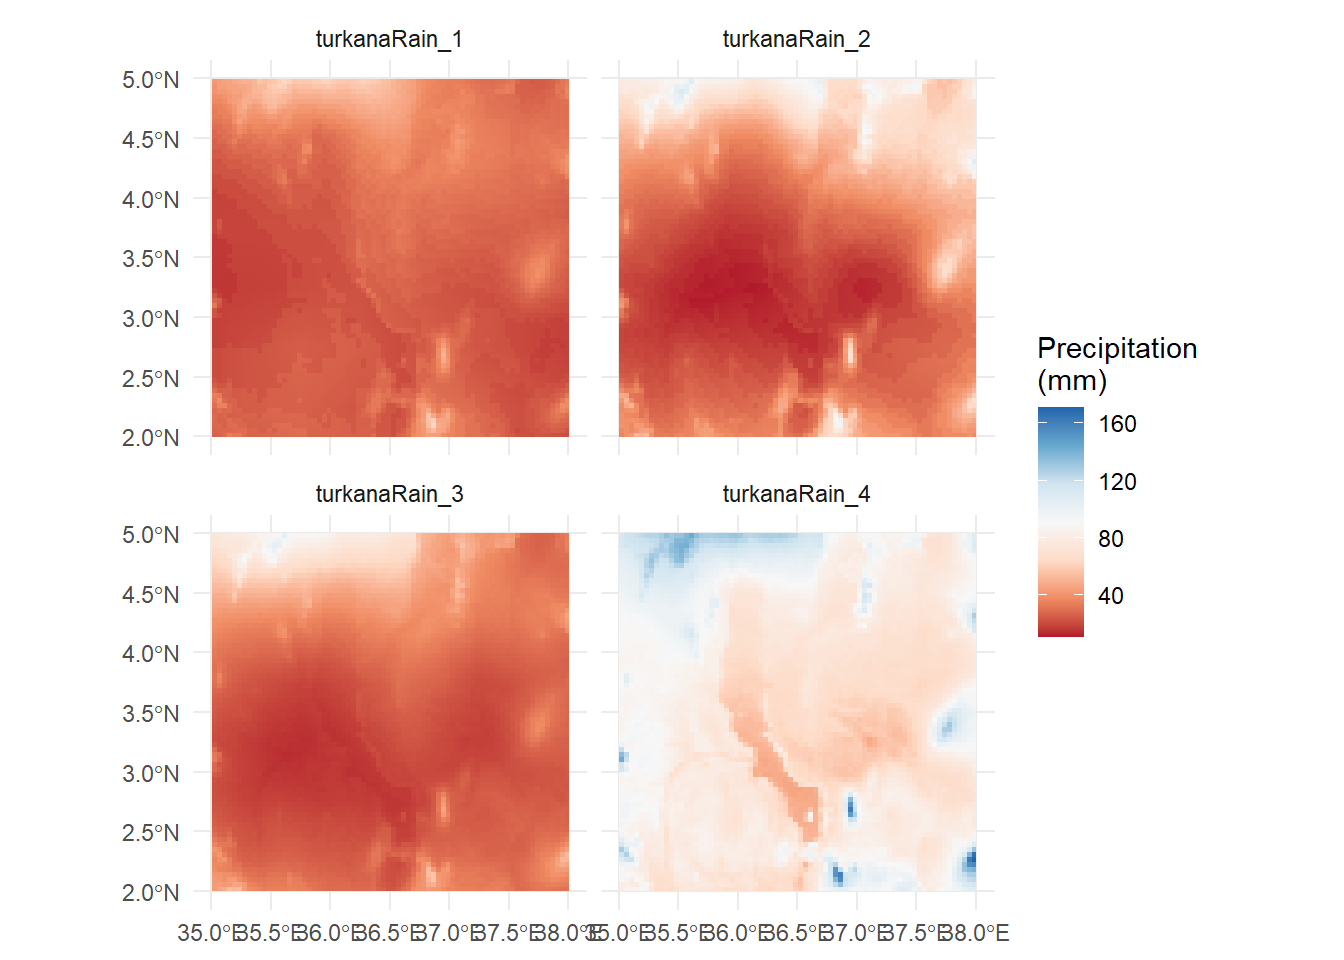
Note that bit at the end where it reads na.values="black". This can be used in any scale_color_* or scale_fill_* function to account data points that have NA values. It’s important to make sure that your NA values are colored using a value that does not appear in your scale. However, here we have no NA values, so there are no black cells.