library(tidyverse)
library(sf)Week 8 Lab
Introduction
Environmental data is often spatial in nature. Think about air quality as an environmental health topic. The effects of air quality on health in a city are determined in part by the topography and wind patterns of the local area, locations where emissions occur, and civic planning of neighborhoods, all of which combine to determine which groups are exposed to more or less polluted air. The geographic context is fundamental for understanding the variability of environmental phenomenon and developing solutions to environmental problems.
Spatial data typically comes in two main flavors: vector and raster. The vector data model is commonly used to represent discrete features: things that exist in some places but not others. Think about the locations of fountains, or roads, or the footprints of buildings: these are all discrete features of a city. Rasters, on the other and, are gridded cells that represent continuous data: think about the distribution of temperatures or levels of particulate matter across a city.
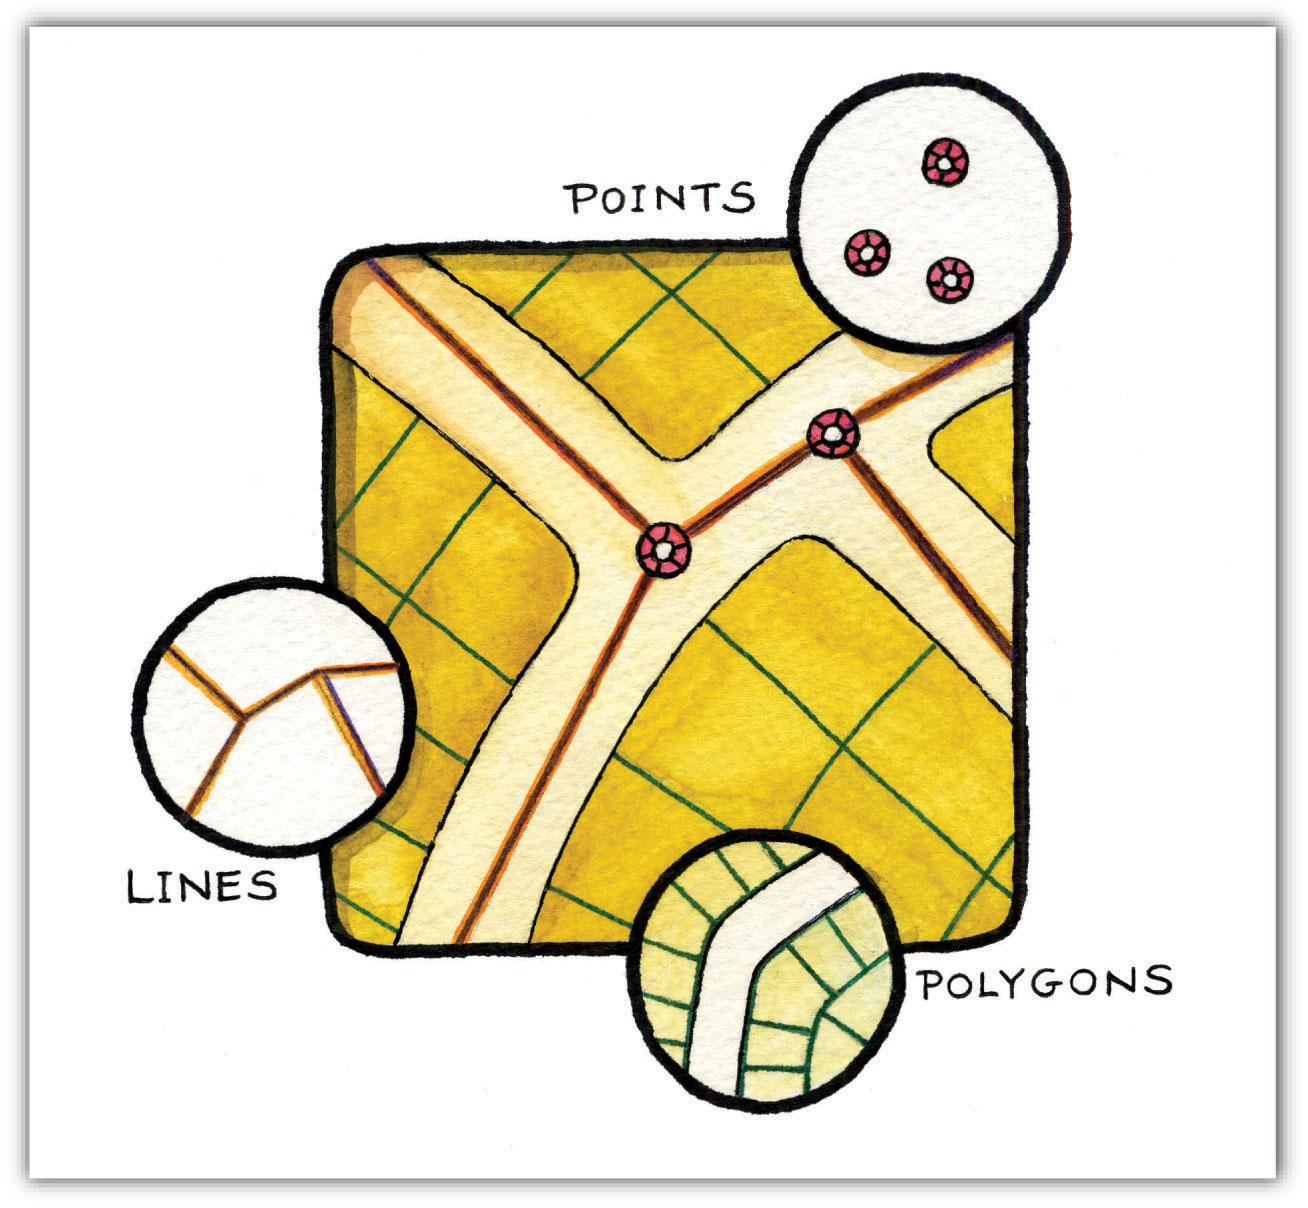
Vector data usually presents spatial objects as one of three kinds of features:
points (a location only)
lines (a series connected points; location AND length)
polygons (a series of connected points that form a closed loop; location AND area)
Additionally, these features can have attributes which are information associated with the spatial object. For example, a polygon representing a building might have attributes such as address, owner’s name, date of construction, current value, etc. For our purposes, attributes are synonymous with variables.
In this lab, we’re going to look at how to handle vector data in R. This allows us to integrate spatial data into our analyses without having to jump between software platforms, and share code and data in a way that is free and fully reproducible. Our main tool for doing this will be the sf package:
The sf package uses the Simple Features object format, where spatial information are stored as tables with a special “geometry” column. This makes them more flexible for use by other packages. You can read more about Simple Features here, and about the history of spatial data handling in R here.
The data for today’s lab is on Canvas in the Week8LabData.zip file.